Immigrants from Romania vs Immigrants from Vietnam College, 1 year or more
COMPARE
Immigrants from Romania
Immigrants from Vietnam
College, 1 year or more
College, 1 year or more Comparison
Immigrants from Romania
Immigrants from Vietnam
63.3%
COLLEGE, 1 YEAR OR MORE
99.3/ 100
METRIC RATING
67th/ 347
METRIC RANK
58.2%
COLLEGE, 1 YEAR OR MORE
18.2/ 100
METRIC RATING
206th/ 347
METRIC RANK
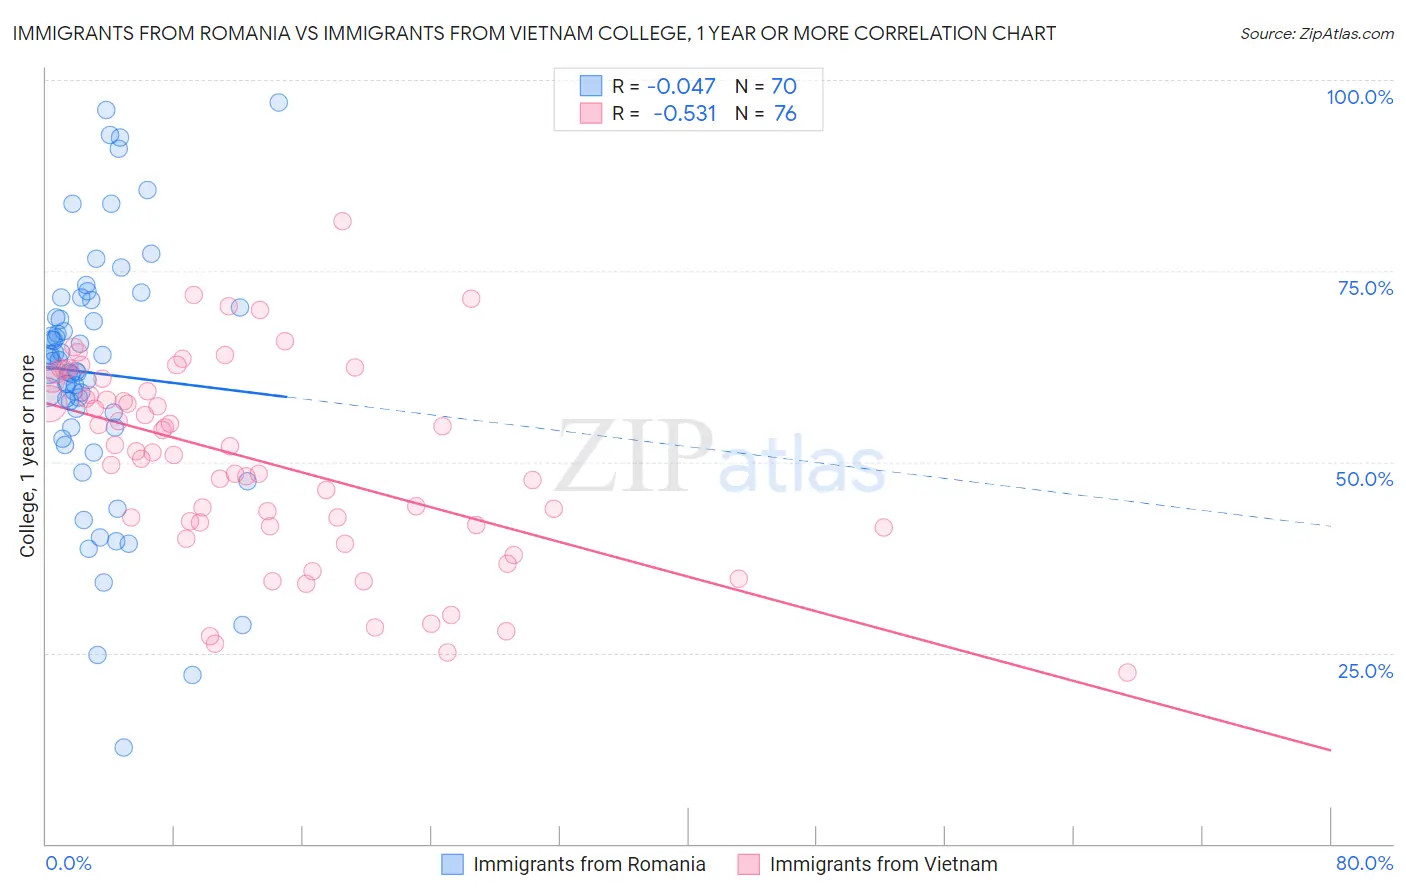
Immigrants from Romania vs Immigrants from Vietnam College, 1 year or more Correlation Chart
The statistical analysis conducted on geographies consisting of 257,014,354 people shows no correlation between the proportion of Immigrants from Romania and percentage of population with at least college, 1 year or more education in the United States with a correlation coefficient (R) of -0.047 and weighted average of 63.3%. Similarly, the statistical analysis conducted on geographies consisting of 404,840,629 people shows a substantial negative correlation between the proportion of Immigrants from Vietnam and percentage of population with at least college, 1 year or more education in the United States with a correlation coefficient (R) of -0.531 and weighted average of 58.2%, a difference of 8.7%.
College, 1 year or more Correlation Summary
| Measurement | Immigrants from Romania | Immigrants from Vietnam |
| Minimum | 12.7% | 22.4% |
| Maximum | 97.0% | 81.5% |
| Range | 84.3% | 59.1% |
| Mean | 61.6% | 50.1% |
| Median | 62.6% | 51.3% |
| Interquartile 25% (IQ1) | 54.6% | 41.6% |
| Interquartile 75% (IQ3) | 70.2% | 60.0% |
| Interquartile Range (IQR) | 15.6% | 18.4% |
| Standard Deviation (Sample) | 16.7% | 12.9% |
| Standard Deviation (Population) | 16.5% | 12.8% |
Similar Demographics by College, 1 year or more
Demographics Similar to Immigrants from Romania by College, 1 year or more
In terms of college, 1 year or more, the demographic groups most similar to Immigrants from Romania are Immigrants from Europe (63.3%, a difference of 0.020%), Immigrants from Greece (63.3%, a difference of 0.020%), Immigrants from Zimbabwe (63.3%, a difference of 0.020%), Maltese (63.4%, a difference of 0.12%), and Argentinean (63.2%, a difference of 0.12%).
| Demographics | Rating | Rank | College, 1 year or more |
| Immigrants | Kazakhstan | 99.5 /100 | #60 | Exceptional 63.6% |
| Bolivians | 99.5 /100 | #61 | Exceptional 63.5% |
| Immigrants | Indonesia | 99.5 /100 | #62 | Exceptional 63.5% |
| Immigrants | Scotland | 99.4 /100 | #63 | Exceptional 63.4% |
| Immigrants | Spain | 99.4 /100 | #64 | Exceptional 63.4% |
| Maltese | 99.3 /100 | #65 | Exceptional 63.4% |
| Immigrants | Europe | 99.3 /100 | #66 | Exceptional 63.3% |
| Immigrants | Romania | 99.3 /100 | #67 | Exceptional 63.3% |
| Immigrants | Greece | 99.3 /100 | #68 | Exceptional 63.3% |
| Immigrants | Zimbabwe | 99.3 /100 | #69 | Exceptional 63.3% |
| Argentineans | 99.2 /100 | #70 | Exceptional 63.2% |
| Immigrants | Canada | 99.1 /100 | #71 | Exceptional 63.1% |
| Egyptians | 99.0 /100 | #72 | Exceptional 63.1% |
| Immigrants | Moldova | 99.0 /100 | #73 | Exceptional 63.0% |
| Immigrants | North America | 99.0 /100 | #74 | Exceptional 63.0% |
Demographics Similar to Immigrants from Vietnam by College, 1 year or more
In terms of college, 1 year or more, the demographic groups most similar to Immigrants from Vietnam are Immigrants from Zaire (58.3%, a difference of 0.040%), Panamanian (58.3%, a difference of 0.090%), Senegalese (58.2%, a difference of 0.12%), Ghanaian (58.4%, a difference of 0.23%), and Immigrants from Uruguay (58.1%, a difference of 0.29%).
| Demographics | Rating | Rank | College, 1 year or more |
| Slovaks | 24.6 /100 | #199 | Fair 58.5% |
| Spanish | 24.2 /100 | #200 | Fair 58.5% |
| Nigerians | 23.0 /100 | #201 | Fair 58.5% |
| Immigrants | South America | 21.9 /100 | #202 | Fair 58.4% |
| Ghanaians | 20.9 /100 | #203 | Fair 58.4% |
| Panamanians | 19.2 /100 | #204 | Poor 58.3% |
| Immigrants | Zaire | 18.7 /100 | #205 | Poor 58.3% |
| Immigrants | Vietnam | 18.2 /100 | #206 | Poor 58.2% |
| Senegalese | 16.9 /100 | #207 | Poor 58.2% |
| Immigrants | Uruguay | 15.2 /100 | #208 | Poor 58.1% |
| Immigrants | Middle Africa | 14.0 /100 | #209 | Poor 58.0% |
| Tsimshian | 13.5 /100 | #210 | Poor 57.9% |
| Immigrants | Nigeria | 13.3 /100 | #211 | Poor 57.9% |
| Immigrants | Senegal | 11.8 /100 | #212 | Poor 57.8% |
| French Canadians | 11.8 /100 | #213 | Poor 57.8% |