Immigrants from Romania vs Immigrants from England College, 1 year or more
COMPARE
Immigrants from Romania
Immigrants from England
College, 1 year or more
College, 1 year or more Comparison
Immigrants from Romania
Immigrants from England
63.3%
COLLEGE, 1 YEAR OR MORE
99.3/ 100
METRIC RATING
67th/ 347
METRIC RANK
62.8%
COLLEGE, 1 YEAR OR MORE
98.6/ 100
METRIC RATING
84th/ 347
METRIC RANK
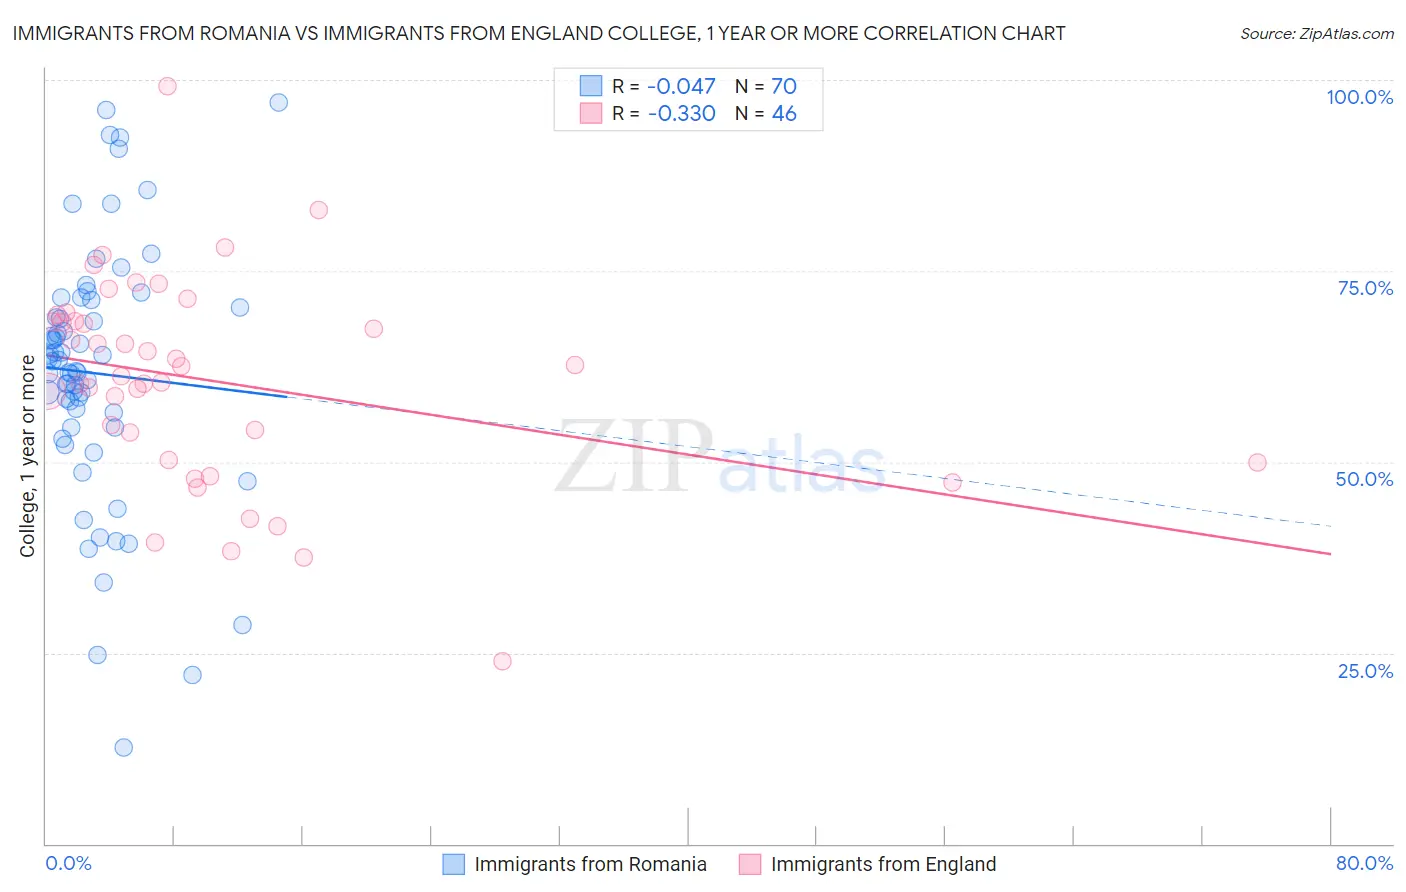
Immigrants from Romania vs Immigrants from England College, 1 year or more Correlation Chart
The statistical analysis conducted on geographies consisting of 257,014,354 people shows no correlation between the proportion of Immigrants from Romania and percentage of population with at least college, 1 year or more education in the United States with a correlation coefficient (R) of -0.047 and weighted average of 63.3%. Similarly, the statistical analysis conducted on geographies consisting of 391,895,815 people shows a mild negative correlation between the proportion of Immigrants from England and percentage of population with at least college, 1 year or more education in the United States with a correlation coefficient (R) of -0.330 and weighted average of 62.8%, a difference of 0.82%.
College, 1 year or more Correlation Summary
| Measurement | Immigrants from Romania | Immigrants from England |
| Minimum | 12.7% | 23.9% |
| Maximum | 97.0% | 99.1% |
| Range | 84.3% | 75.3% |
| Mean | 61.6% | 60.6% |
| Median | 62.6% | 61.9% |
| Interquartile 25% (IQ1) | 54.6% | 50.3% |
| Interquartile 75% (IQ3) | 70.2% | 68.4% |
| Interquartile Range (IQR) | 15.6% | 18.1% |
| Standard Deviation (Sample) | 16.7% | 13.7% |
| Standard Deviation (Population) | 16.5% | 13.6% |
Demographics Similar to Immigrants from Romania and Immigrants from England by College, 1 year or more
In terms of college, 1 year or more, the demographic groups most similar to Immigrants from Romania are Immigrants from Europe (63.3%, a difference of 0.020%), Immigrants from Greece (63.3%, a difference of 0.020%), Immigrants from Zimbabwe (63.3%, a difference of 0.020%), Maltese (63.4%, a difference of 0.12%), and Argentinean (63.2%, a difference of 0.12%). Similarly, the demographic groups most similar to Immigrants from England are Immigrants from Pakistan (62.8%, a difference of 0.010%), Immigrants from Argentina (62.8%, a difference of 0.030%), Immigrants from Bolivia (62.8%, a difference of 0.070%), Laotian (62.8%, a difference of 0.12%), and Lithuanian (62.9%, a difference of 0.17%).
| Demographics | Rating | Rank | College, 1 year or more |
| Maltese | 99.3 /100 | #65 | Exceptional 63.4% |
| Immigrants | Europe | 99.3 /100 | #66 | Exceptional 63.3% |
| Immigrants | Romania | 99.3 /100 | #67 | Exceptional 63.3% |
| Immigrants | Greece | 99.3 /100 | #68 | Exceptional 63.3% |
| Immigrants | Zimbabwe | 99.3 /100 | #69 | Exceptional 63.3% |
| Argentineans | 99.2 /100 | #70 | Exceptional 63.2% |
| Immigrants | Canada | 99.1 /100 | #71 | Exceptional 63.1% |
| Egyptians | 99.0 /100 | #72 | Exceptional 63.1% |
| Immigrants | Moldova | 99.0 /100 | #73 | Exceptional 63.0% |
| Immigrants | North America | 99.0 /100 | #74 | Exceptional 63.0% |
| Armenians | 98.9 /100 | #75 | Exceptional 63.0% |
| Paraguayans | 98.8 /100 | #76 | Exceptional 62.9% |
| Ethiopians | 98.8 /100 | #77 | Exceptional 62.9% |
| Immigrants | Lebanon | 98.8 /100 | #78 | Exceptional 62.9% |
| Northern Europeans | 98.8 /100 | #79 | Exceptional 62.9% |
| Lithuanians | 98.8 /100 | #80 | Exceptional 62.9% |
| Laotians | 98.7 /100 | #81 | Exceptional 62.8% |
| Immigrants | Bolivia | 98.7 /100 | #82 | Exceptional 62.8% |
| Immigrants | Argentina | 98.6 /100 | #83 | Exceptional 62.8% |
| Immigrants | England | 98.6 /100 | #84 | Exceptional 62.8% |
| Immigrants | Pakistan | 98.6 /100 | #85 | Exceptional 62.8% |