Immigrants from Romania vs Albanian College, 1 year or more
COMPARE
Immigrants from Romania
Albanian
College, 1 year or more
College, 1 year or more Comparison
Immigrants from Romania
Albanians
63.3%
COLLEGE, 1 YEAR OR MORE
99.3/ 100
METRIC RATING
67th/ 347
METRIC RANK
60.4%
COLLEGE, 1 YEAR OR MORE
77.8/ 100
METRIC RATING
151st/ 347
METRIC RANK
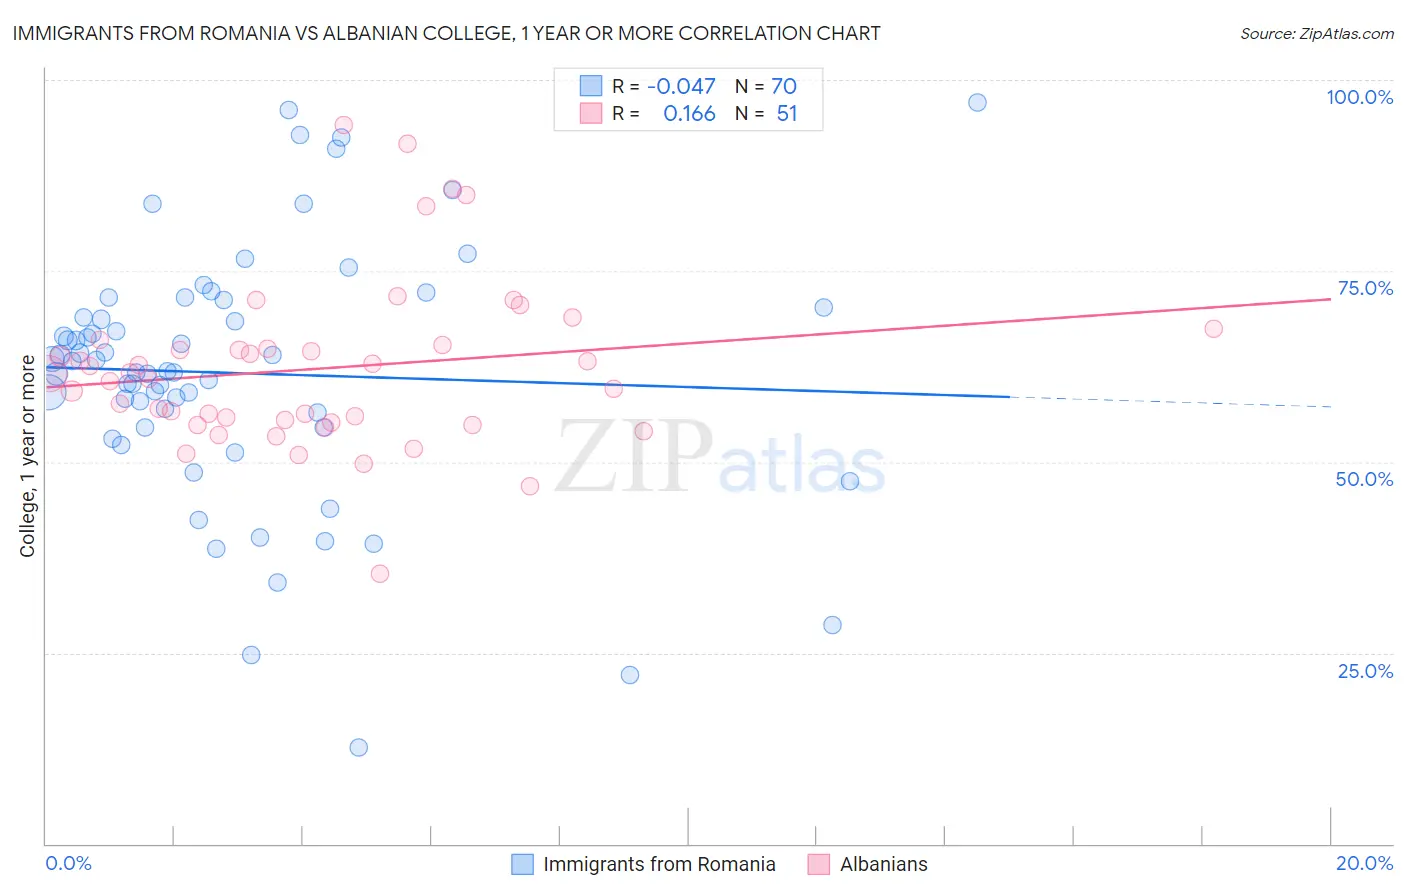
Immigrants from Romania vs Albanian College, 1 year or more Correlation Chart
The statistical analysis conducted on geographies consisting of 257,014,354 people shows no correlation between the proportion of Immigrants from Romania and percentage of population with at least college, 1 year or more education in the United States with a correlation coefficient (R) of -0.047 and weighted average of 63.3%. Similarly, the statistical analysis conducted on geographies consisting of 193,265,709 people shows a poor positive correlation between the proportion of Albanians and percentage of population with at least college, 1 year or more education in the United States with a correlation coefficient (R) of 0.166 and weighted average of 60.4%, a difference of 4.8%.
College, 1 year or more Correlation Summary
| Measurement | Immigrants from Romania | Albanian |
| Minimum | 12.7% | 35.4% |
| Maximum | 97.0% | 94.1% |
| Range | 84.3% | 58.7% |
| Mean | 61.6% | 62.2% |
| Median | 62.6% | 61.5% |
| Interquartile 25% (IQ1) | 54.6% | 55.2% |
| Interquartile 75% (IQ3) | 70.2% | 65.3% |
| Interquartile Range (IQR) | 15.6% | 10.1% |
| Standard Deviation (Sample) | 16.7% | 11.0% |
| Standard Deviation (Population) | 16.5% | 10.9% |
Similar Demographics by College, 1 year or more
Demographics Similar to Immigrants from Romania by College, 1 year or more
In terms of college, 1 year or more, the demographic groups most similar to Immigrants from Romania are Immigrants from Europe (63.3%, a difference of 0.020%), Immigrants from Greece (63.3%, a difference of 0.020%), Immigrants from Zimbabwe (63.3%, a difference of 0.020%), Maltese (63.4%, a difference of 0.12%), and Argentinean (63.2%, a difference of 0.12%).
| Demographics | Rating | Rank | College, 1 year or more |
| Immigrants | Kazakhstan | 99.5 /100 | #60 | Exceptional 63.6% |
| Bolivians | 99.5 /100 | #61 | Exceptional 63.5% |
| Immigrants | Indonesia | 99.5 /100 | #62 | Exceptional 63.5% |
| Immigrants | Scotland | 99.4 /100 | #63 | Exceptional 63.4% |
| Immigrants | Spain | 99.4 /100 | #64 | Exceptional 63.4% |
| Maltese | 99.3 /100 | #65 | Exceptional 63.4% |
| Immigrants | Europe | 99.3 /100 | #66 | Exceptional 63.3% |
| Immigrants | Romania | 99.3 /100 | #67 | Exceptional 63.3% |
| Immigrants | Greece | 99.3 /100 | #68 | Exceptional 63.3% |
| Immigrants | Zimbabwe | 99.3 /100 | #69 | Exceptional 63.3% |
| Argentineans | 99.2 /100 | #70 | Exceptional 63.2% |
| Immigrants | Canada | 99.1 /100 | #71 | Exceptional 63.1% |
| Egyptians | 99.0 /100 | #72 | Exceptional 63.1% |
| Immigrants | Moldova | 99.0 /100 | #73 | Exceptional 63.0% |
| Immigrants | North America | 99.0 /100 | #74 | Exceptional 63.0% |
Demographics Similar to Albanians by College, 1 year or more
In terms of college, 1 year or more, the demographic groups most similar to Albanians are Immigrants from Sudan (60.4%, a difference of 0.0%), Kenyan (60.5%, a difference of 0.090%), Brazilian (60.5%, a difference of 0.090%), Immigrants from Kenya (60.5%, a difference of 0.10%), and Immigrants from Germany (60.3%, a difference of 0.13%).
| Demographics | Rating | Rank | College, 1 year or more |
| Czechs | 81.9 /100 | #144 | Excellent 60.6% |
| Slavs | 81.1 /100 | #145 | Excellent 60.6% |
| Scottish | 80.2 /100 | #146 | Excellent 60.5% |
| Immigrants | Kenya | 79.1 /100 | #147 | Good 60.5% |
| Kenyans | 79.0 /100 | #148 | Good 60.5% |
| Brazilians | 79.0 /100 | #149 | Good 60.5% |
| Immigrants | Sudan | 77.8 /100 | #150 | Good 60.4% |
| Albanians | 77.8 /100 | #151 | Good 60.4% |
| Immigrants | Germany | 76.1 /100 | #152 | Good 60.3% |
| Sierra Leoneans | 74.1 /100 | #153 | Good 60.2% |
| Sudanese | 73.0 /100 | #154 | Good 60.2% |
| Moroccans | 72.9 /100 | #155 | Good 60.2% |
| Finns | 72.9 /100 | #156 | Good 60.2% |
| Immigrants | Armenia | 68.8 /100 | #157 | Good 60.0% |
| English | 67.2 /100 | #158 | Good 60.0% |