Immigrants from Romania vs Dominican 1st Grade
COMPARE
Immigrants from Romania
Dominican
1st Grade
1st Grade Comparison
Immigrants from Romania
Dominicans
98.1%
1ST GRADE
87.8/ 100
METRIC RATING
138th/ 347
METRIC RANK
96.7%
1ST GRADE
0.0/ 100
METRIC RATING
325th/ 347
METRIC RANK
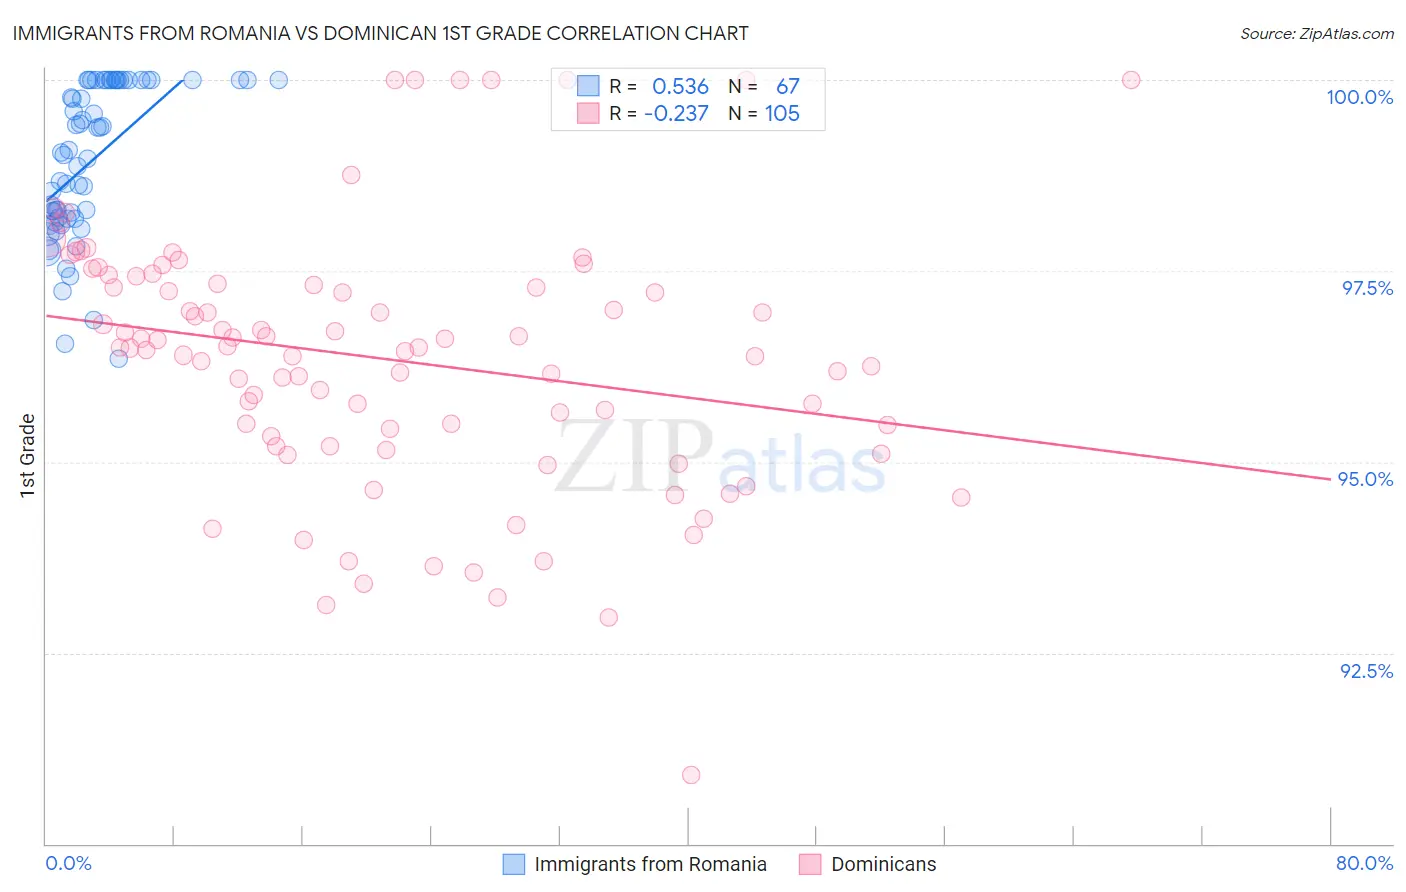
Immigrants from Romania vs Dominican 1st Grade Correlation Chart
The statistical analysis conducted on geographies consisting of 257,006,599 people shows a substantial positive correlation between the proportion of Immigrants from Romania and percentage of population with at least 1st grade education in the United States with a correlation coefficient (R) of 0.536 and weighted average of 98.1%. Similarly, the statistical analysis conducted on geographies consisting of 355,142,603 people shows a weak negative correlation between the proportion of Dominicans and percentage of population with at least 1st grade education in the United States with a correlation coefficient (R) of -0.237 and weighted average of 96.7%, a difference of 1.4%.
1st Grade Correlation Summary
| Measurement | Immigrants from Romania | Dominican |
| Minimum | 96.4% | 90.9% |
| Maximum | 100.0% | 100.0% |
| Range | 3.6% | 9.1% |
| Mean | 98.9% | 96.4% |
| Median | 99.1% | 96.5% |
| Interquartile 25% (IQ1) | 98.2% | 95.3% |
| Interquartile 75% (IQ3) | 100.0% | 97.4% |
| Interquartile Range (IQR) | 1.8% | 2.1% |
| Standard Deviation (Sample) | 1.00% | 1.7% |
| Standard Deviation (Population) | 0.99% | 1.7% |
Similar Demographics by 1st Grade
Demographics Similar to Immigrants from Romania by 1st Grade
In terms of 1st grade, the demographic groups most similar to Immigrants from Romania are Israeli (98.1%, a difference of 0.0%), Blackfeet (98.1%, a difference of 0.0%), Immigrants from Hungary (98.1%, a difference of 0.010%), Immigrants from Kuwait (98.1%, a difference of 0.010%), and Immigrants from Bulgaria (98.1%, a difference of 0.010%).
| Demographics | Rating | Rank | 1st Grade |
| Spaniards | 91.2 /100 | #131 | Exceptional 98.1% |
| Cambodians | 90.9 /100 | #132 | Exceptional 98.1% |
| Immigrants | Europe | 90.5 /100 | #133 | Exceptional 98.1% |
| Immigrants | Hungary | 89.4 /100 | #134 | Excellent 98.1% |
| Immigrants | Kuwait | 89.3 /100 | #135 | Excellent 98.1% |
| Immigrants | Bulgaria | 88.8 /100 | #136 | Excellent 98.1% |
| Israelis | 87.8 /100 | #137 | Excellent 98.1% |
| Immigrants | Romania | 87.8 /100 | #138 | Excellent 98.1% |
| Blackfeet | 87.6 /100 | #139 | Excellent 98.1% |
| Palestinians | 83.0 /100 | #140 | Excellent 98.0% |
| Immigrants | Turkey | 82.8 /100 | #141 | Excellent 98.0% |
| Marshallese | 82.0 /100 | #142 | Excellent 98.0% |
| Burmese | 81.0 /100 | #143 | Excellent 98.0% |
| Alsatians | 80.9 /100 | #144 | Excellent 98.0% |
| Hmong | 79.0 /100 | #145 | Good 98.0% |
Demographics Similar to Dominicans by 1st Grade
In terms of 1st grade, the demographic groups most similar to Dominicans are Indonesian (96.7%, a difference of 0.0%), Vietnamese (96.8%, a difference of 0.020%), Immigrants from Honduras (96.8%, a difference of 0.030%), Mexican American Indian (96.8%, a difference of 0.040%), and Immigrants from Burma/Myanmar (96.8%, a difference of 0.060%).
| Demographics | Rating | Rank | 1st Grade |
| Immigrants | Laos | 0.0 /100 | #318 | Tragic 96.8% |
| Immigrants | Guyana | 0.0 /100 | #319 | Tragic 96.8% |
| Immigrants | Burma/Myanmar | 0.0 /100 | #320 | Tragic 96.8% |
| Immigrants | Bangladesh | 0.0 /100 | #321 | Tragic 96.8% |
| Mexican American Indians | 0.0 /100 | #322 | Tragic 96.8% |
| Immigrants | Honduras | 0.0 /100 | #323 | Tragic 96.8% |
| Vietnamese | 0.0 /100 | #324 | Tragic 96.8% |
| Dominicans | 0.0 /100 | #325 | Tragic 96.7% |
| Indonesians | 0.0 /100 | #326 | Tragic 96.7% |
| Mexicans | 0.0 /100 | #327 | Tragic 96.7% |
| Immigrants | Latin America | 0.0 /100 | #328 | Tragic 96.7% |
| Japanese | 0.0 /100 | #329 | Tragic 96.6% |
| Immigrants | Vietnam | 0.0 /100 | #330 | Tragic 96.6% |
| Immigrants | Armenia | 0.0 /100 | #331 | Tragic 96.6% |
| Central Americans | 0.0 /100 | #332 | Tragic 96.5% |