Osage vs Dominican College, 1 year or more
COMPARE
Osage
Dominican
College, 1 year or more
College, 1 year or more Comparison
Osage
Dominicans
55.8%
COLLEGE, 1 YEAR OR MORE
1.0/ 100
METRIC RATING
243rd/ 347
METRIC RANK
50.6%
COLLEGE, 1 YEAR OR MORE
0.0/ 100
METRIC RATING
326th/ 347
METRIC RANK
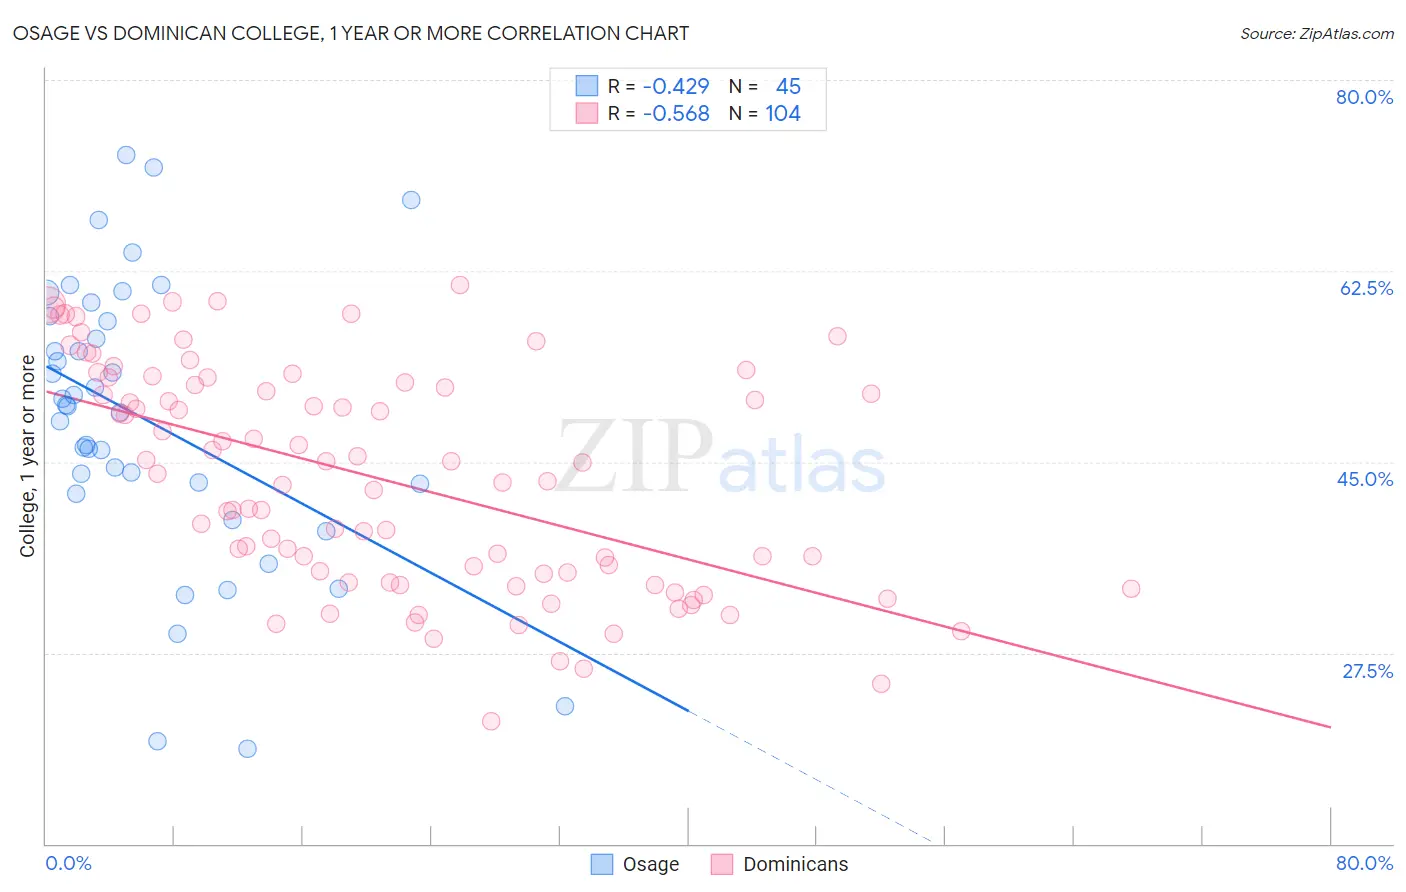
Osage vs Dominican College, 1 year or more Correlation Chart
The statistical analysis conducted on geographies consisting of 91,808,929 people shows a moderate negative correlation between the proportion of Osage and percentage of population with at least college, 1 year or more education in the United States with a correlation coefficient (R) of -0.429 and weighted average of 55.8%. Similarly, the statistical analysis conducted on geographies consisting of 355,140,033 people shows a substantial negative correlation between the proportion of Dominicans and percentage of population with at least college, 1 year or more education in the United States with a correlation coefficient (R) of -0.568 and weighted average of 50.6%, a difference of 10.2%.
College, 1 year or more Correlation Summary
| Measurement | Osage | Dominican |
| Minimum | 18.8% | 21.3% |
| Maximum | 73.1% | 61.3% |
| Range | 54.3% | 40.0% |
| Mean | 48.7% | 43.4% |
| Median | 50.1% | 43.6% |
| Interquartile 25% (IQ1) | 42.6% | 34.3% |
| Interquartile 75% (IQ3) | 58.1% | 52.2% |
| Interquartile Range (IQR) | 15.5% | 17.8% |
| Standard Deviation (Sample) | 12.9% | 10.1% |
| Standard Deviation (Population) | 12.8% | 10.1% |
Similar Demographics by College, 1 year or more
Demographics Similar to Osage by College, 1 year or more
In terms of college, 1 year or more, the demographic groups most similar to Osage are Marshallese (55.8%, a difference of 0.010%), French American Indian (55.8%, a difference of 0.12%), Chippewa (55.7%, a difference of 0.12%), Trinidadian and Tobagonian (55.8%, a difference of 0.16%), and Immigrants from Liberia (55.7%, a difference of 0.19%).
| Demographics | Rating | Rank | College, 1 year or more |
| Iroquois | 1.7 /100 | #236 | Tragic 56.2% |
| Samoans | 1.6 /100 | #237 | Tragic 56.2% |
| Barbadians | 1.3 /100 | #238 | Tragic 56.0% |
| Puget Sound Salish | 1.1 /100 | #239 | Tragic 55.9% |
| Trinidadians and Tobagonians | 1.1 /100 | #240 | Tragic 55.8% |
| French American Indians | 1.0 /100 | #241 | Tragic 55.8% |
| Marshallese | 1.0 /100 | #242 | Tragic 55.8% |
| Osage | 1.0 /100 | #243 | Tragic 55.8% |
| Chippewa | 0.9 /100 | #244 | Tragic 55.7% |
| Immigrants | Liberia | 0.8 /100 | #245 | Tragic 55.7% |
| Malaysians | 0.8 /100 | #246 | Tragic 55.6% |
| Hawaiians | 0.8 /100 | #247 | Tragic 55.6% |
| Immigrants | Congo | 0.8 /100 | #248 | Tragic 55.6% |
| Immigrants | Trinidad and Tobago | 0.7 /100 | #249 | Tragic 55.5% |
| Delaware | 0.7 /100 | #250 | Tragic 55.5% |
Demographics Similar to Dominicans by College, 1 year or more
In terms of college, 1 year or more, the demographic groups most similar to Dominicans are Menominee (50.6%, a difference of 0.040%), Dutch West Indian (50.5%, a difference of 0.15%), Immigrants from Latin America (50.7%, a difference of 0.18%), Immigrants from Cuba (50.7%, a difference of 0.21%), and Immigrants from Guatemala (50.7%, a difference of 0.22%).
| Demographics | Rating | Rank | College, 1 year or more |
| Immigrants | El Salvador | 0.0 /100 | #319 | Tragic 51.0% |
| Kiowa | 0.0 /100 | #320 | Tragic 51.0% |
| Hopi | 0.0 /100 | #321 | Tragic 50.9% |
| Navajo | 0.0 /100 | #322 | Tragic 50.8% |
| Immigrants | Guatemala | 0.0 /100 | #323 | Tragic 50.7% |
| Immigrants | Cuba | 0.0 /100 | #324 | Tragic 50.7% |
| Immigrants | Latin America | 0.0 /100 | #325 | Tragic 50.7% |
| Dominicans | 0.0 /100 | #326 | Tragic 50.6% |
| Menominee | 0.0 /100 | #327 | Tragic 50.6% |
| Dutch West Indians | 0.0 /100 | #328 | Tragic 50.5% |
| Cape Verdeans | 0.0 /100 | #329 | Tragic 50.3% |
| Natives/Alaskans | 0.0 /100 | #330 | Tragic 50.2% |
| Immigrants | Yemen | 0.0 /100 | #331 | Tragic 50.0% |
| Mexicans | 0.0 /100 | #332 | Tragic 49.2% |
| Immigrants | Dominican Republic | 0.0 /100 | #333 | Tragic 49.1% |