Immigrants from Thailand vs Dominican College, 1 year or more
COMPARE
Immigrants from Thailand
Dominican
College, 1 year or more
College, 1 year or more Comparison
Immigrants from Thailand
Dominicans
58.6%
COLLEGE, 1 YEAR OR MORE
26.0/ 100
METRIC RATING
197th/ 347
METRIC RANK
50.6%
COLLEGE, 1 YEAR OR MORE
0.0/ 100
METRIC RATING
326th/ 347
METRIC RANK
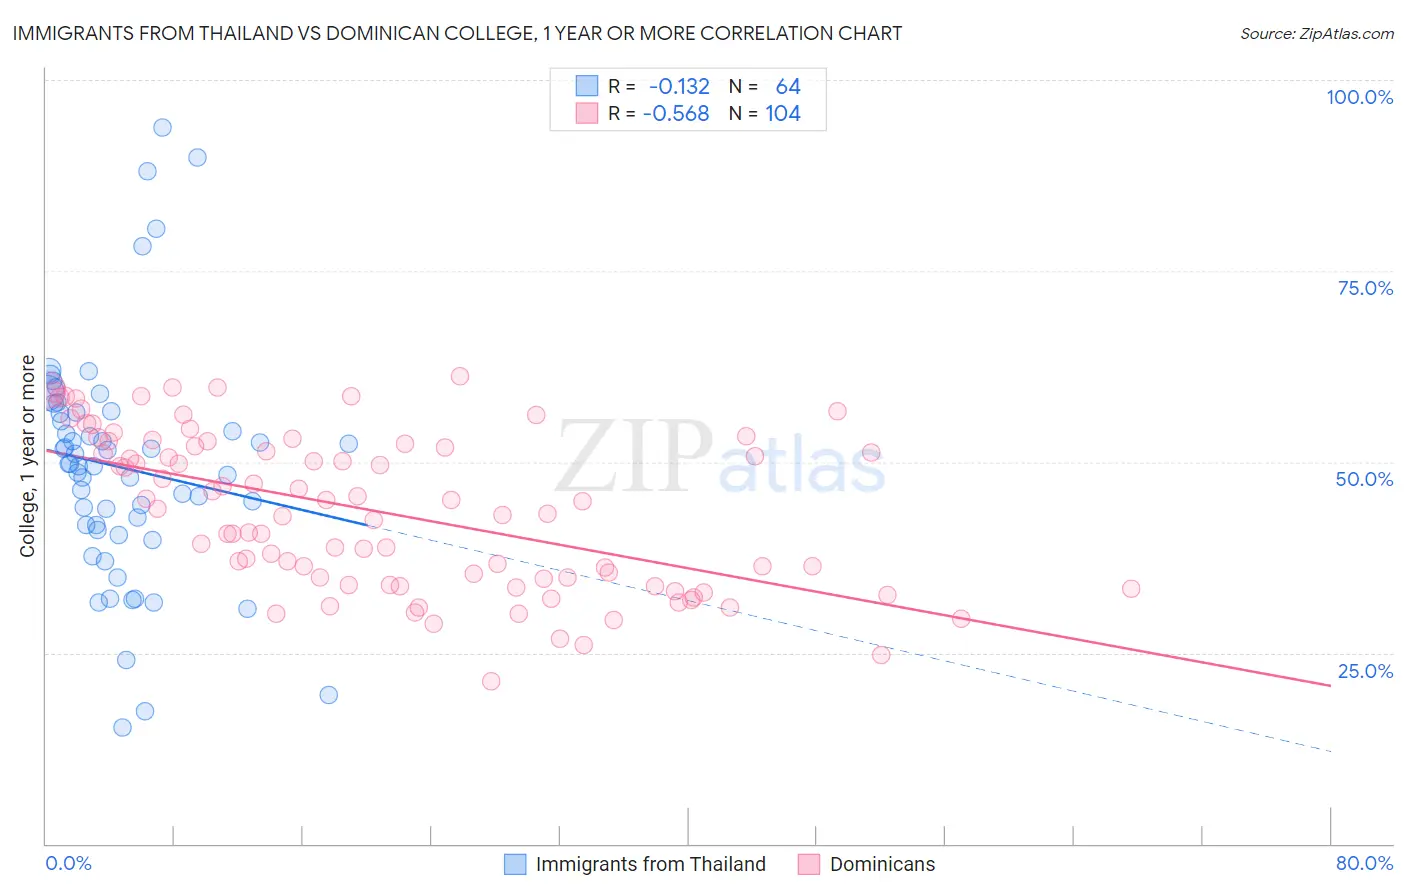
Immigrants from Thailand vs Dominican College, 1 year or more Correlation Chart
The statistical analysis conducted on geographies consisting of 317,023,435 people shows a poor negative correlation between the proportion of Immigrants from Thailand and percentage of population with at least college, 1 year or more education in the United States with a correlation coefficient (R) of -0.132 and weighted average of 58.6%. Similarly, the statistical analysis conducted on geographies consisting of 355,140,033 people shows a substantial negative correlation between the proportion of Dominicans and percentage of population with at least college, 1 year or more education in the United States with a correlation coefficient (R) of -0.568 and weighted average of 50.6%, a difference of 15.8%.
College, 1 year or more Correlation Summary
| Measurement | Immigrants from Thailand | Dominican |
| Minimum | 15.2% | 21.3% |
| Maximum | 93.8% | 61.3% |
| Range | 78.6% | 40.0% |
| Mean | 49.3% | 43.4% |
| Median | 49.6% | 43.6% |
| Interquartile 25% (IQ1) | 41.4% | 34.3% |
| Interquartile 75% (IQ3) | 56.5% | 52.2% |
| Interquartile Range (IQR) | 15.1% | 17.8% |
| Standard Deviation (Sample) | 15.4% | 10.1% |
| Standard Deviation (Population) | 15.3% | 10.1% |
Similar Demographics by College, 1 year or more
Demographics Similar to Immigrants from Thailand by College, 1 year or more
In terms of college, 1 year or more, the demographic groups most similar to Immigrants from Thailand are Dutch (58.6%, a difference of 0.010%), Guamanian/Chamorro (58.6%, a difference of 0.010%), Costa Rican (58.6%, a difference of 0.030%), Immigrants from South Eastern Asia (58.5%, a difference of 0.070%), and Peruvian (58.6%, a difference of 0.10%).
| Demographics | Rating | Rank | College, 1 year or more |
| Immigrants | Cameroon | 31.2 /100 | #190 | Fair 58.8% |
| Immigrants | Philippines | 29.2 /100 | #191 | Fair 58.7% |
| Colombians | 27.6 /100 | #192 | Fair 58.7% |
| Peruvians | 27.5 /100 | #193 | Fair 58.6% |
| Costa Ricans | 26.4 /100 | #194 | Fair 58.6% |
| Dutch | 26.2 /100 | #195 | Fair 58.6% |
| Guamanians/Chamorros | 26.2 /100 | #196 | Fair 58.6% |
| Immigrants | Thailand | 26.0 /100 | #197 | Fair 58.6% |
| Immigrants | South Eastern Asia | 25.1 /100 | #198 | Fair 58.5% |
| Slovaks | 24.6 /100 | #199 | Fair 58.5% |
| Spanish | 24.2 /100 | #200 | Fair 58.5% |
| Nigerians | 23.0 /100 | #201 | Fair 58.5% |
| Immigrants | South America | 21.9 /100 | #202 | Fair 58.4% |
| Ghanaians | 20.9 /100 | #203 | Fair 58.4% |
| Panamanians | 19.2 /100 | #204 | Poor 58.3% |
Demographics Similar to Dominicans by College, 1 year or more
In terms of college, 1 year or more, the demographic groups most similar to Dominicans are Menominee (50.6%, a difference of 0.040%), Dutch West Indian (50.5%, a difference of 0.15%), Immigrants from Latin America (50.7%, a difference of 0.18%), Immigrants from Cuba (50.7%, a difference of 0.21%), and Immigrants from Guatemala (50.7%, a difference of 0.22%).
| Demographics | Rating | Rank | College, 1 year or more |
| Immigrants | El Salvador | 0.0 /100 | #319 | Tragic 51.0% |
| Kiowa | 0.0 /100 | #320 | Tragic 51.0% |
| Hopi | 0.0 /100 | #321 | Tragic 50.9% |
| Navajo | 0.0 /100 | #322 | Tragic 50.8% |
| Immigrants | Guatemala | 0.0 /100 | #323 | Tragic 50.7% |
| Immigrants | Cuba | 0.0 /100 | #324 | Tragic 50.7% |
| Immigrants | Latin America | 0.0 /100 | #325 | Tragic 50.7% |
| Dominicans | 0.0 /100 | #326 | Tragic 50.6% |
| Menominee | 0.0 /100 | #327 | Tragic 50.6% |
| Dutch West Indians | 0.0 /100 | #328 | Tragic 50.5% |
| Cape Verdeans | 0.0 /100 | #329 | Tragic 50.3% |
| Natives/Alaskans | 0.0 /100 | #330 | Tragic 50.2% |
| Immigrants | Yemen | 0.0 /100 | #331 | Tragic 50.0% |
| Mexicans | 0.0 /100 | #332 | Tragic 49.2% |
| Immigrants | Dominican Republic | 0.0 /100 | #333 | Tragic 49.1% |