Bulgarian vs Dominican College, 1 year or more
COMPARE
Bulgarian
Dominican
College, 1 year or more
College, 1 year or more Comparison
Bulgarians
Dominicans
65.5%
COLLEGE, 1 YEAR OR MORE
100.0/ 100
METRIC RATING
32nd/ 347
METRIC RANK
50.6%
COLLEGE, 1 YEAR OR MORE
0.0/ 100
METRIC RATING
326th/ 347
METRIC RANK
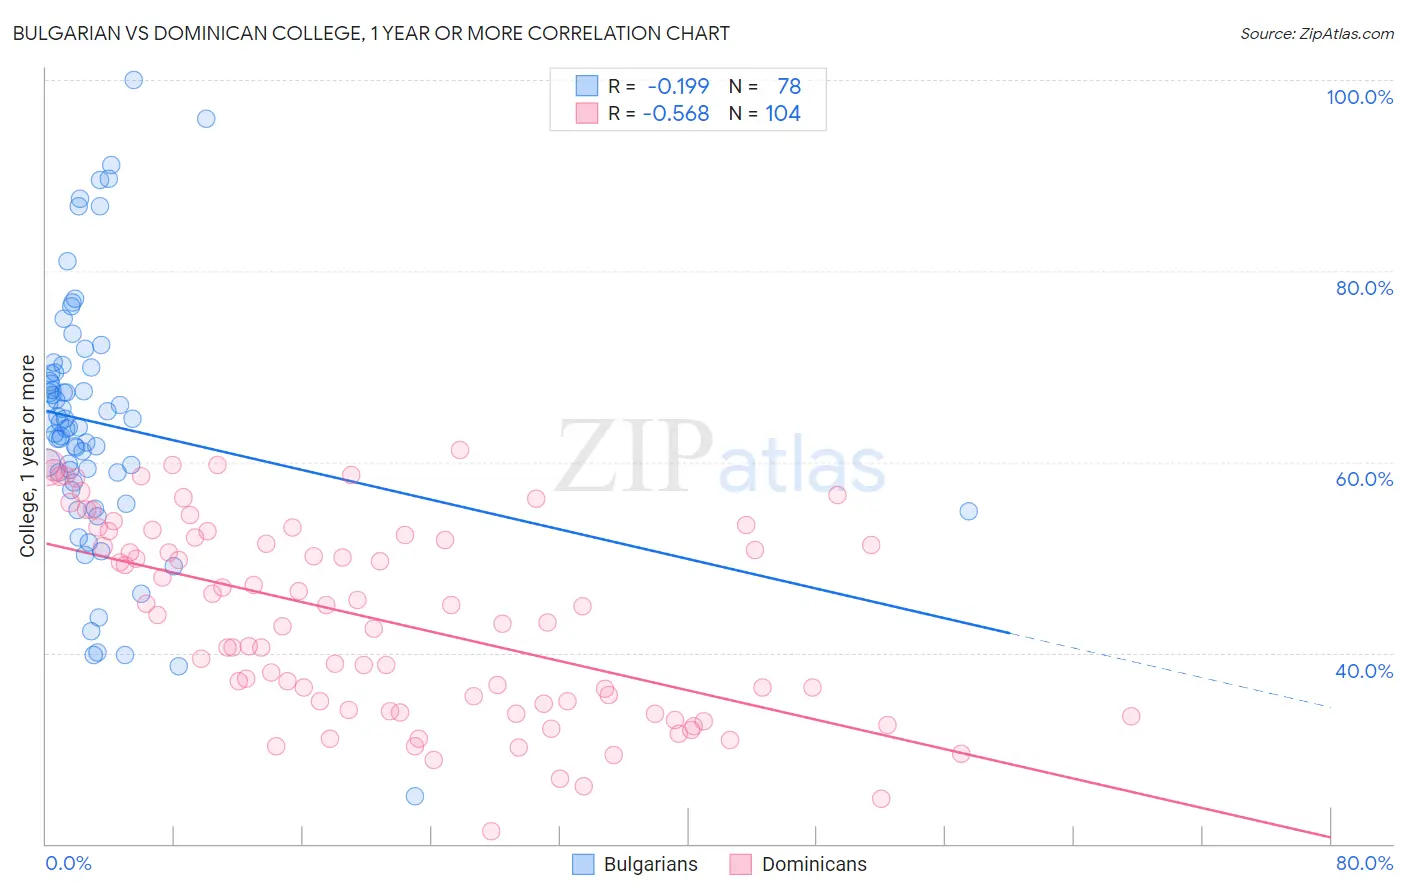
Bulgarian vs Dominican College, 1 year or more Correlation Chart
The statistical analysis conducted on geographies consisting of 205,631,725 people shows a poor negative correlation between the proportion of Bulgarians and percentage of population with at least college, 1 year or more education in the United States with a correlation coefficient (R) of -0.199 and weighted average of 65.5%. Similarly, the statistical analysis conducted on geographies consisting of 355,140,033 people shows a substantial negative correlation between the proportion of Dominicans and percentage of population with at least college, 1 year or more education in the United States with a correlation coefficient (R) of -0.568 and weighted average of 50.6%, a difference of 29.5%.
College, 1 year or more Correlation Summary
| Measurement | Bulgarian | Dominican |
| Minimum | 25.0% | 21.3% |
| Maximum | 100.0% | 61.3% |
| Range | 75.0% | 40.0% |
| Mean | 64.0% | 43.4% |
| Median | 63.9% | 43.6% |
| Interquartile 25% (IQ1) | 57.8% | 34.3% |
| Interquartile 75% (IQ3) | 69.4% | 52.2% |
| Interquartile Range (IQR) | 11.5% | 17.8% |
| Standard Deviation (Sample) | 13.5% | 10.1% |
| Standard Deviation (Population) | 13.4% | 10.1% |
Similar Demographics by College, 1 year or more
Demographics Similar to Bulgarians by College, 1 year or more
In terms of college, 1 year or more, the demographic groups most similar to Bulgarians are Turkish (65.5%, a difference of 0.050%), Immigrants from Denmark (65.6%, a difference of 0.13%), Immigrants from Sri Lanka (65.4%, a difference of 0.15%), Immigrants from Northern Europe (65.6%, a difference of 0.24%), and Israeli (65.3%, a difference of 0.27%).
| Demographics | Rating | Rank | College, 1 year or more |
| Indians (Asian) | 100.0 /100 | #25 | Exceptional 66.1% |
| Latvians | 100.0 /100 | #26 | Exceptional 66.1% |
| Immigrants | Ireland | 100.0 /100 | #27 | Exceptional 65.9% |
| Immigrants | France | 100.0 /100 | #28 | Exceptional 65.8% |
| Immigrants | Northern Europe | 100.0 /100 | #29 | Exceptional 65.6% |
| Immigrants | Denmark | 100.0 /100 | #30 | Exceptional 65.6% |
| Turks | 100.0 /100 | #31 | Exceptional 65.5% |
| Bulgarians | 100.0 /100 | #32 | Exceptional 65.5% |
| Immigrants | Sri Lanka | 99.9 /100 | #33 | Exceptional 65.4% |
| Israelis | 99.9 /100 | #34 | Exceptional 65.3% |
| Immigrants | Turkey | 99.9 /100 | #35 | Exceptional 65.2% |
| Immigrants | South Africa | 99.9 /100 | #36 | Exceptional 65.1% |
| Russians | 99.9 /100 | #37 | Exceptional 65.1% |
| Immigrants | Saudi Arabia | 99.9 /100 | #38 | Exceptional 65.0% |
| Estonians | 99.9 /100 | #39 | Exceptional 65.0% |
Demographics Similar to Dominicans by College, 1 year or more
In terms of college, 1 year or more, the demographic groups most similar to Dominicans are Menominee (50.6%, a difference of 0.040%), Dutch West Indian (50.5%, a difference of 0.15%), Immigrants from Latin America (50.7%, a difference of 0.18%), Immigrants from Cuba (50.7%, a difference of 0.21%), and Immigrants from Guatemala (50.7%, a difference of 0.22%).
| Demographics | Rating | Rank | College, 1 year or more |
| Immigrants | El Salvador | 0.0 /100 | #319 | Tragic 51.0% |
| Kiowa | 0.0 /100 | #320 | Tragic 51.0% |
| Hopi | 0.0 /100 | #321 | Tragic 50.9% |
| Navajo | 0.0 /100 | #322 | Tragic 50.8% |
| Immigrants | Guatemala | 0.0 /100 | #323 | Tragic 50.7% |
| Immigrants | Cuba | 0.0 /100 | #324 | Tragic 50.7% |
| Immigrants | Latin America | 0.0 /100 | #325 | Tragic 50.7% |
| Dominicans | 0.0 /100 | #326 | Tragic 50.6% |
| Menominee | 0.0 /100 | #327 | Tragic 50.6% |
| Dutch West Indians | 0.0 /100 | #328 | Tragic 50.5% |
| Cape Verdeans | 0.0 /100 | #329 | Tragic 50.3% |
| Natives/Alaskans | 0.0 /100 | #330 | Tragic 50.2% |
| Immigrants | Yemen | 0.0 /100 | #331 | Tragic 50.0% |
| Mexicans | 0.0 /100 | #332 | Tragic 49.2% |
| Immigrants | Dominican Republic | 0.0 /100 | #333 | Tragic 49.1% |