Immigrants from Oceania vs Jamaican GED/Equivalency
COMPARE
Immigrants from Oceania
Jamaican
GED/Equivalency
GED/Equivalency Comparison
Immigrants from Oceania
Jamaicans
85.5%
GED/EQUIVALENCY
33.6/ 100
METRIC RATING
184th/ 347
METRIC RANK
83.3%
GED/EQUIVALENCY
0.4/ 100
METRIC RATING
257th/ 347
METRIC RANK
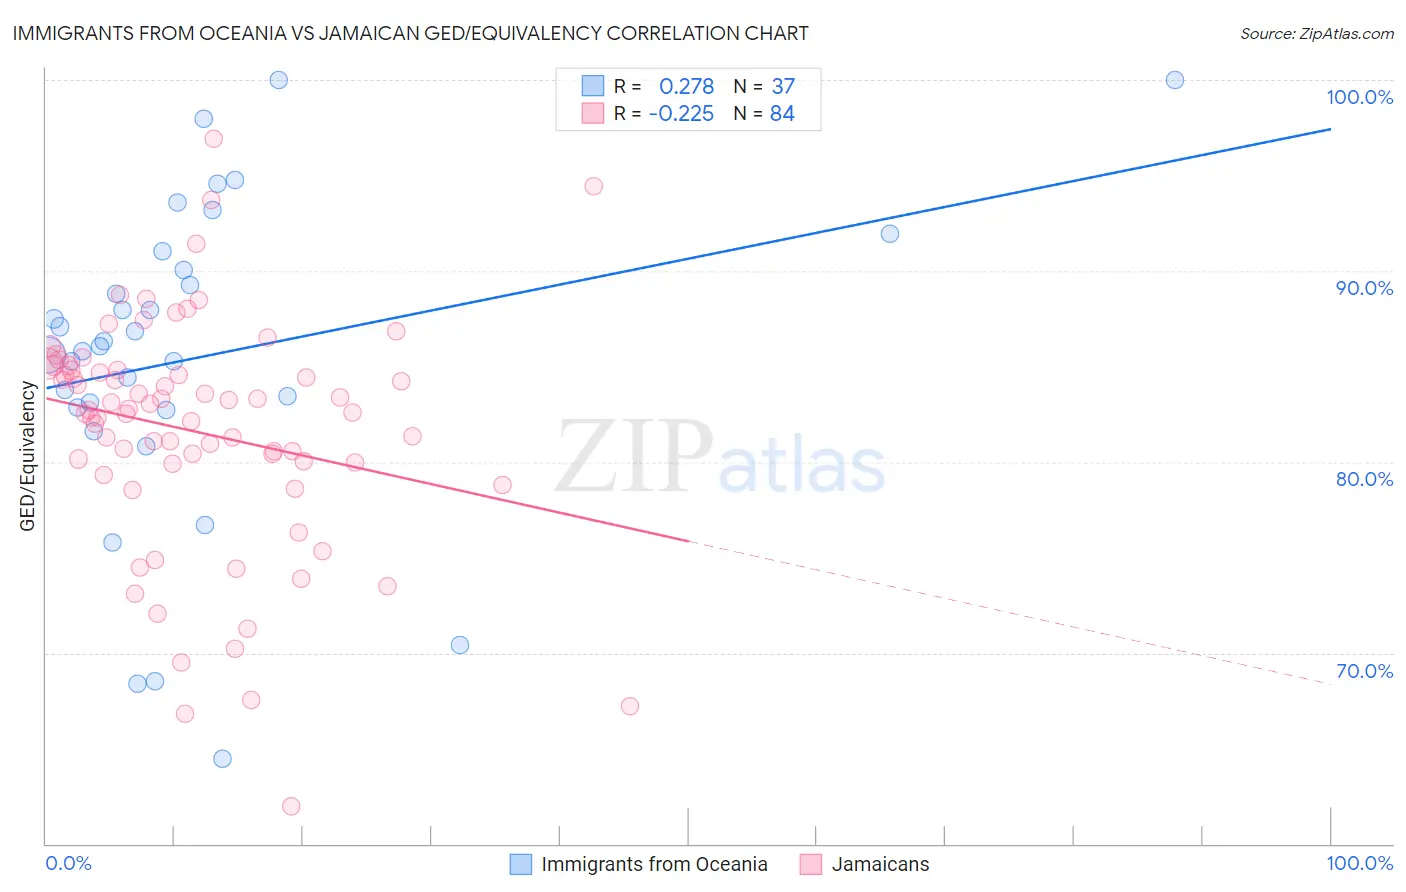
Immigrants from Oceania vs Jamaican GED/Equivalency Correlation Chart
The statistical analysis conducted on geographies consisting of 305,521,521 people shows a weak positive correlation between the proportion of Immigrants from Oceania and percentage of population with at least ged/equivalency education in the United States with a correlation coefficient (R) of 0.278 and weighted average of 85.5%. Similarly, the statistical analysis conducted on geographies consisting of 368,084,562 people shows a weak negative correlation between the proportion of Jamaicans and percentage of population with at least ged/equivalency education in the United States with a correlation coefficient (R) of -0.225 and weighted average of 83.3%, a difference of 2.6%.
GED/Equivalency Correlation Summary
| Measurement | Immigrants from Oceania | Jamaican |
| Minimum | 64.5% | 61.9% |
| Maximum | 100.0% | 96.9% |
| Range | 35.5% | 35.0% |
| Mean | 85.5% | 81.6% |
| Median | 86.1% | 82.7% |
| Interquartile 25% (IQ1) | 82.8% | 80.0% |
| Interquartile 75% (IQ3) | 90.5% | 84.8% |
| Interquartile Range (IQR) | 7.7% | 4.8% |
| Standard Deviation (Sample) | 8.3% | 6.2% |
| Standard Deviation (Population) | 8.2% | 6.1% |
Similar Demographics by GED/Equivalency
Demographics Similar to Immigrants from Oceania by GED/Equivalency
In terms of ged/equivalency, the demographic groups most similar to Immigrants from Oceania are Immigrants from Sudan (85.5%, a difference of 0.010%), Spanish (85.4%, a difference of 0.020%), Sudanese (85.5%, a difference of 0.040%), Spaniard (85.4%, a difference of 0.040%), and Moroccan (85.5%, a difference of 0.090%).
| Demographics | Rating | Rank | GED/Equivalency |
| Immigrants | Uganda | 45.2 /100 | #177 | Average 85.7% |
| Koreans | 41.2 /100 | #178 | Average 85.6% |
| Aleuts | 40.5 /100 | #179 | Average 85.6% |
| Immigrants | Southern Europe | 38.4 /100 | #180 | Fair 85.5% |
| Moroccans | 37.7 /100 | #181 | Fair 85.5% |
| Sudanese | 35.2 /100 | #182 | Fair 85.5% |
| Immigrants | Sudan | 34.2 /100 | #183 | Fair 85.5% |
| Immigrants | Oceania | 33.6 /100 | #184 | Fair 85.5% |
| Spanish | 32.8 /100 | #185 | Fair 85.4% |
| Spaniards | 31.9 /100 | #186 | Fair 85.4% |
| Immigrants | Afghanistan | 29.8 /100 | #187 | Fair 85.4% |
| Immigrants | Sierra Leone | 29.0 /100 | #188 | Fair 85.4% |
| Guamanians/Chamorros | 28.4 /100 | #189 | Fair 85.3% |
| Alaskan Athabascans | 27.5 /100 | #190 | Fair 85.3% |
| South American Indians | 22.8 /100 | #191 | Fair 85.2% |
Demographics Similar to Jamaicans by GED/Equivalency
In terms of ged/equivalency, the demographic groups most similar to Jamaicans are Malaysian (83.3%, a difference of 0.030%), African (83.4%, a difference of 0.13%), Colville (83.4%, a difference of 0.14%), Immigrants from Vietnam (83.2%, a difference of 0.17%), and Choctaw (83.1%, a difference of 0.20%).
| Demographics | Rating | Rank | GED/Equivalency |
| Shoshone | 1.0 /100 | #250 | Tragic 83.7% |
| Spanish Americans | 0.8 /100 | #251 | Tragic 83.6% |
| Bahamians | 0.8 /100 | #252 | Tragic 83.6% |
| Comanche | 0.7 /100 | #253 | Tragic 83.6% |
| Creek | 0.7 /100 | #254 | Tragic 83.6% |
| Colville | 0.5 /100 | #255 | Tragic 83.4% |
| Africans | 0.5 /100 | #256 | Tragic 83.4% |
| Jamaicans | 0.4 /100 | #257 | Tragic 83.3% |
| Malaysians | 0.4 /100 | #258 | Tragic 83.3% |
| Immigrants | Vietnam | 0.3 /100 | #259 | Tragic 83.2% |
| Choctaw | 0.3 /100 | #260 | Tragic 83.1% |
| Inupiat | 0.2 /100 | #261 | Tragic 83.1% |
| Immigrants | Armenia | 0.2 /100 | #262 | Tragic 83.1% |
| Immigrants | Congo | 0.2 /100 | #263 | Tragic 83.1% |
| Bangladeshis | 0.2 /100 | #264 | Tragic 83.1% |