Immigrants from Oceania vs Vietnamese GED/Equivalency
COMPARE
Immigrants from Oceania
Vietnamese
GED/Equivalency
GED/Equivalency Comparison
Immigrants from Oceania
Vietnamese
85.5%
GED/EQUIVALENCY
33.6/ 100
METRIC RATING
184th/ 347
METRIC RANK
81.9%
GED/EQUIVALENCY
0.0/ 100
METRIC RATING
296th/ 347
METRIC RANK
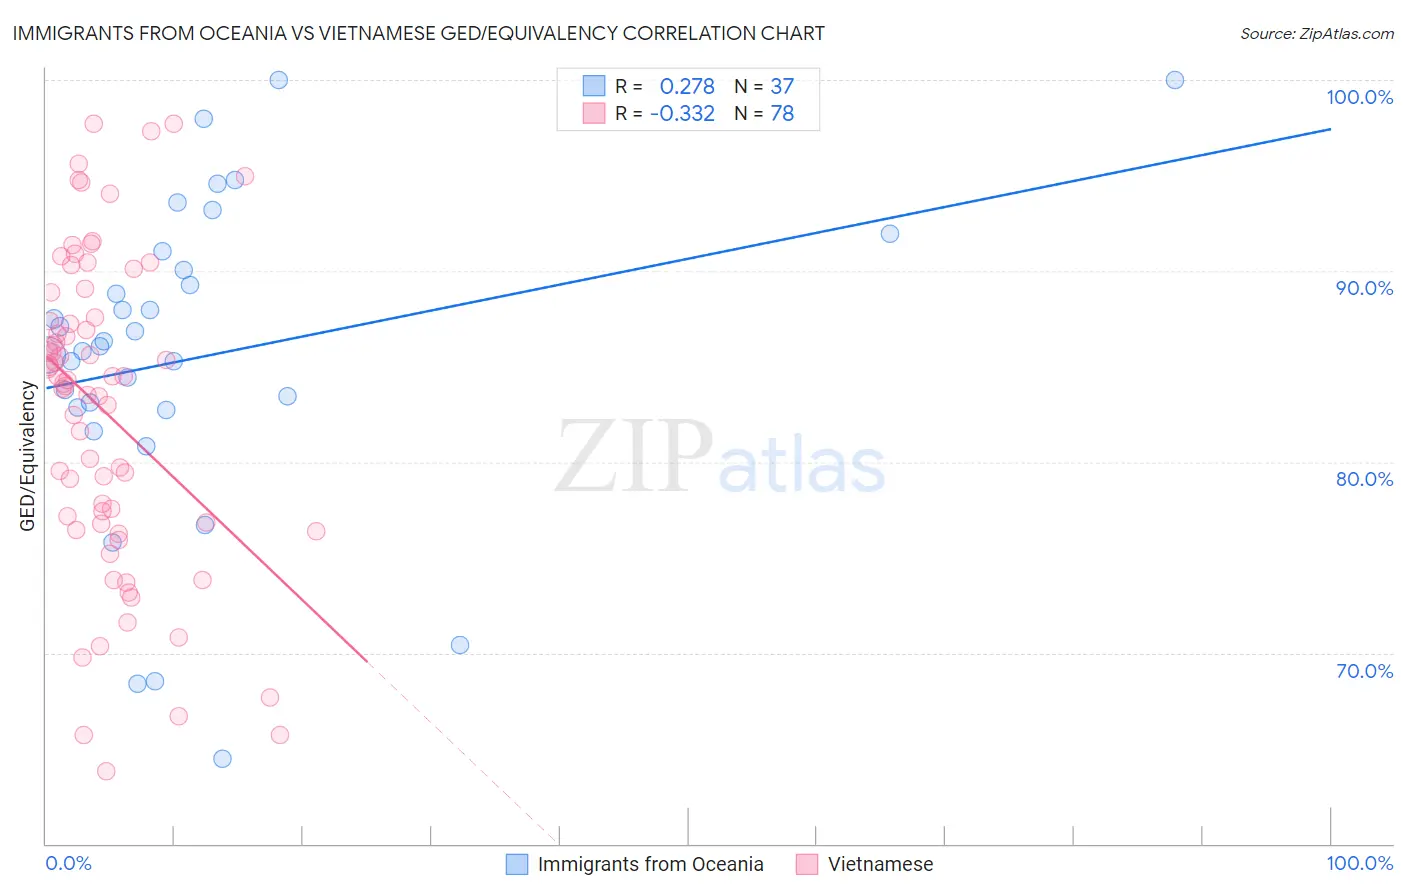
Immigrants from Oceania vs Vietnamese GED/Equivalency Correlation Chart
The statistical analysis conducted on geographies consisting of 305,521,521 people shows a weak positive correlation between the proportion of Immigrants from Oceania and percentage of population with at least ged/equivalency education in the United States with a correlation coefficient (R) of 0.278 and weighted average of 85.5%. Similarly, the statistical analysis conducted on geographies consisting of 170,753,564 people shows a mild negative correlation between the proportion of Vietnamese and percentage of population with at least ged/equivalency education in the United States with a correlation coefficient (R) of -0.332 and weighted average of 81.9%, a difference of 4.3%.
GED/Equivalency Correlation Summary
| Measurement | Immigrants from Oceania | Vietnamese |
| Minimum | 64.5% | 63.8% |
| Maximum | 100.0% | 97.7% |
| Range | 35.5% | 34.0% |
| Mean | 85.5% | 82.6% |
| Median | 86.1% | 84.2% |
| Interquartile 25% (IQ1) | 82.8% | 76.8% |
| Interquartile 75% (IQ3) | 90.5% | 87.6% |
| Interquartile Range (IQR) | 7.7% | 10.8% |
| Standard Deviation (Sample) | 8.3% | 8.2% |
| Standard Deviation (Population) | 8.2% | 8.1% |
Similar Demographics by GED/Equivalency
Demographics Similar to Immigrants from Oceania by GED/Equivalency
In terms of ged/equivalency, the demographic groups most similar to Immigrants from Oceania are Immigrants from Sudan (85.5%, a difference of 0.010%), Spanish (85.4%, a difference of 0.020%), Sudanese (85.5%, a difference of 0.040%), Spaniard (85.4%, a difference of 0.040%), and Moroccan (85.5%, a difference of 0.090%).
| Demographics | Rating | Rank | GED/Equivalency |
| Immigrants | Uganda | 45.2 /100 | #177 | Average 85.7% |
| Koreans | 41.2 /100 | #178 | Average 85.6% |
| Aleuts | 40.5 /100 | #179 | Average 85.6% |
| Immigrants | Southern Europe | 38.4 /100 | #180 | Fair 85.5% |
| Moroccans | 37.7 /100 | #181 | Fair 85.5% |
| Sudanese | 35.2 /100 | #182 | Fair 85.5% |
| Immigrants | Sudan | 34.2 /100 | #183 | Fair 85.5% |
| Immigrants | Oceania | 33.6 /100 | #184 | Fair 85.5% |
| Spanish | 32.8 /100 | #185 | Fair 85.4% |
| Spaniards | 31.9 /100 | #186 | Fair 85.4% |
| Immigrants | Afghanistan | 29.8 /100 | #187 | Fair 85.4% |
| Immigrants | Sierra Leone | 29.0 /100 | #188 | Fair 85.4% |
| Guamanians/Chamorros | 28.4 /100 | #189 | Fair 85.3% |
| Alaskan Athabascans | 27.5 /100 | #190 | Fair 85.3% |
| South American Indians | 22.8 /100 | #191 | Fair 85.2% |
Demographics Similar to Vietnamese by GED/Equivalency
In terms of ged/equivalency, the demographic groups most similar to Vietnamese are Nepalese (81.9%, a difference of 0.030%), Immigrants from Bangladesh (81.9%, a difference of 0.040%), Immigrants from St. Vincent and the Grenadines (82.0%, a difference of 0.090%), British West Indian (82.0%, a difference of 0.11%), and Paiute (82.0%, a difference of 0.12%).
| Demographics | Rating | Rank | GED/Equivalency |
| Immigrants | Cambodia | 0.0 /100 | #289 | Tragic 82.2% |
| Haitians | 0.0 /100 | #290 | Tragic 82.1% |
| Cubans | 0.0 /100 | #291 | Tragic 82.0% |
| Paiute | 0.0 /100 | #292 | Tragic 82.0% |
| British West Indians | 0.0 /100 | #293 | Tragic 82.0% |
| Immigrants | St. Vincent and the Grenadines | 0.0 /100 | #294 | Tragic 82.0% |
| Nepalese | 0.0 /100 | #295 | Tragic 81.9% |
| Vietnamese | 0.0 /100 | #296 | Tragic 81.9% |
| Immigrants | Bangladesh | 0.0 /100 | #297 | Tragic 81.9% |
| Ute | 0.0 /100 | #298 | Tragic 81.8% |
| Ecuadorians | 0.0 /100 | #299 | Tragic 81.7% |
| Fijians | 0.0 /100 | #300 | Tragic 81.6% |
| Dutch West Indians | 0.0 /100 | #301 | Tragic 81.6% |
| Immigrants | Haiti | 0.0 /100 | #302 | Tragic 81.6% |
| Immigrants | Portugal | 0.0 /100 | #303 | Tragic 81.6% |