Immigrants from Oceania vs Immigrants from Ireland GED/Equivalency
COMPARE
Immigrants from Oceania
Immigrants from Ireland
GED/Equivalency
GED/Equivalency Comparison
Immigrants from Oceania
Immigrants from Ireland
85.5%
GED/EQUIVALENCY
33.6/ 100
METRIC RATING
184th/ 347
METRIC RANK
88.6%
GED/EQUIVALENCY
99.8/ 100
METRIC RATING
22nd/ 347
METRIC RANK
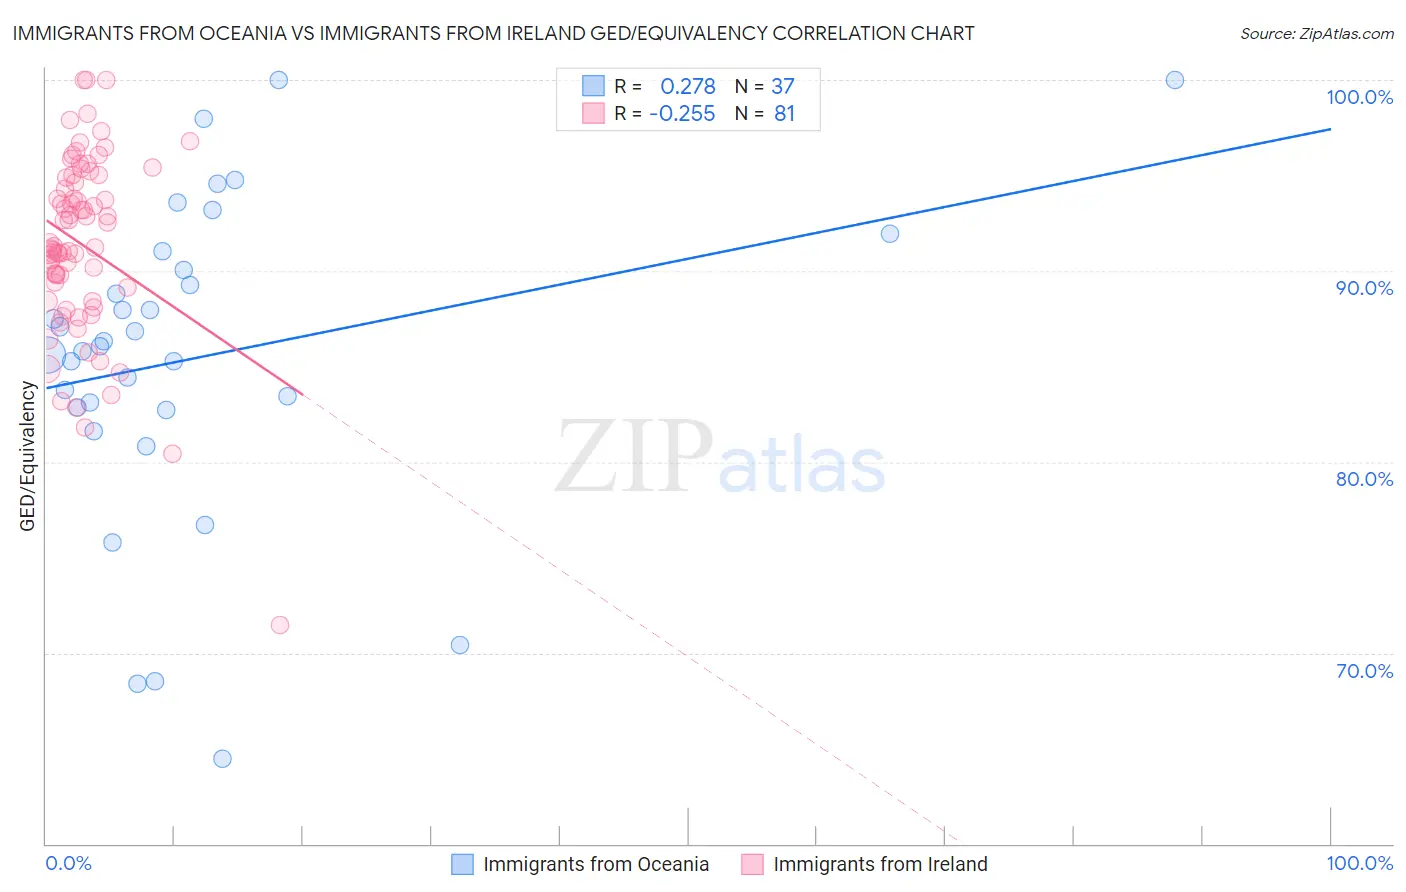
Immigrants from Oceania vs Immigrants from Ireland GED/Equivalency Correlation Chart
The statistical analysis conducted on geographies consisting of 305,521,521 people shows a weak positive correlation between the proportion of Immigrants from Oceania and percentage of population with at least ged/equivalency education in the United States with a correlation coefficient (R) of 0.278 and weighted average of 85.5%. Similarly, the statistical analysis conducted on geographies consisting of 240,784,498 people shows a weak negative correlation between the proportion of Immigrants from Ireland and percentage of population with at least ged/equivalency education in the United States with a correlation coefficient (R) of -0.255 and weighted average of 88.6%, a difference of 3.7%.
GED/Equivalency Correlation Summary
| Measurement | Immigrants from Oceania | Immigrants from Ireland |
| Minimum | 64.5% | 71.4% |
| Maximum | 100.0% | 100.0% |
| Range | 35.5% | 28.6% |
| Mean | 85.5% | 91.4% |
| Median | 86.1% | 91.3% |
| Interquartile 25% (IQ1) | 82.8% | 88.8% |
| Interquartile 75% (IQ3) | 90.5% | 95.0% |
| Interquartile Range (IQR) | 7.7% | 6.2% |
| Standard Deviation (Sample) | 8.3% | 4.8% |
| Standard Deviation (Population) | 8.2% | 4.8% |
Similar Demographics by GED/Equivalency
Demographics Similar to Immigrants from Oceania by GED/Equivalency
In terms of ged/equivalency, the demographic groups most similar to Immigrants from Oceania are Immigrants from Sudan (85.5%, a difference of 0.010%), Spanish (85.4%, a difference of 0.020%), Sudanese (85.5%, a difference of 0.040%), Spaniard (85.4%, a difference of 0.040%), and Moroccan (85.5%, a difference of 0.090%).
| Demographics | Rating | Rank | GED/Equivalency |
| Immigrants | Uganda | 45.2 /100 | #177 | Average 85.7% |
| Koreans | 41.2 /100 | #178 | Average 85.6% |
| Aleuts | 40.5 /100 | #179 | Average 85.6% |
| Immigrants | Southern Europe | 38.4 /100 | #180 | Fair 85.5% |
| Moroccans | 37.7 /100 | #181 | Fair 85.5% |
| Sudanese | 35.2 /100 | #182 | Fair 85.5% |
| Immigrants | Sudan | 34.2 /100 | #183 | Fair 85.5% |
| Immigrants | Oceania | 33.6 /100 | #184 | Fair 85.5% |
| Spanish | 32.8 /100 | #185 | Fair 85.4% |
| Spaniards | 31.9 /100 | #186 | Fair 85.4% |
| Immigrants | Afghanistan | 29.8 /100 | #187 | Fair 85.4% |
| Immigrants | Sierra Leone | 29.0 /100 | #188 | Fair 85.4% |
| Guamanians/Chamorros | 28.4 /100 | #189 | Fair 85.3% |
| Alaskan Athabascans | 27.5 /100 | #190 | Fair 85.3% |
| South American Indians | 22.8 /100 | #191 | Fair 85.2% |
Demographics Similar to Immigrants from Ireland by GED/Equivalency
In terms of ged/equivalency, the demographic groups most similar to Immigrants from Ireland are Luxembourger (88.6%, a difference of 0.010%), Maltese (88.6%, a difference of 0.020%), Russian (88.6%, a difference of 0.020%), Slovak (88.6%, a difference of 0.020%), and Estonian (88.6%, a difference of 0.020%).
| Demographics | Rating | Rank | GED/Equivalency |
| Okinawans | 99.9 /100 | #15 | Exceptional 88.9% |
| Immigrants | Taiwan | 99.9 /100 | #16 | Exceptional 88.8% |
| Croatians | 99.9 /100 | #17 | Exceptional 88.8% |
| Slovenes | 99.9 /100 | #18 | Exceptional 88.8% |
| Swedes | 99.9 /100 | #19 | Exceptional 88.8% |
| Maltese | 99.9 /100 | #20 | Exceptional 88.6% |
| Luxembourgers | 99.8 /100 | #21 | Exceptional 88.6% |
| Immigrants | Ireland | 99.8 /100 | #22 | Exceptional 88.6% |
| Russians | 99.8 /100 | #23 | Exceptional 88.6% |
| Slovaks | 99.8 /100 | #24 | Exceptional 88.6% |
| Estonians | 99.8 /100 | #25 | Exceptional 88.6% |
| Immigrants | Australia | 99.8 /100 | #26 | Exceptional 88.6% |
| Immigrants | Lithuania | 99.8 /100 | #27 | Exceptional 88.6% |
| Immigrants | Northern Europe | 99.8 /100 | #28 | Exceptional 88.5% |
| Poles | 99.8 /100 | #29 | Exceptional 88.5% |