Immigrants from Northern Europe vs Immigrants from Mexico GED/Equivalency
COMPARE
Immigrants from Northern Europe
Immigrants from Mexico
GED/Equivalency
GED/Equivalency Comparison
Immigrants from Northern Europe
Immigrants from Mexico
88.5%
GED/EQUIVALENCY
99.8/ 100
METRIC RATING
28th/ 347
METRIC RANK
75.7%
GED/EQUIVALENCY
0.0/ 100
METRIC RATING
345th/ 347
METRIC RANK
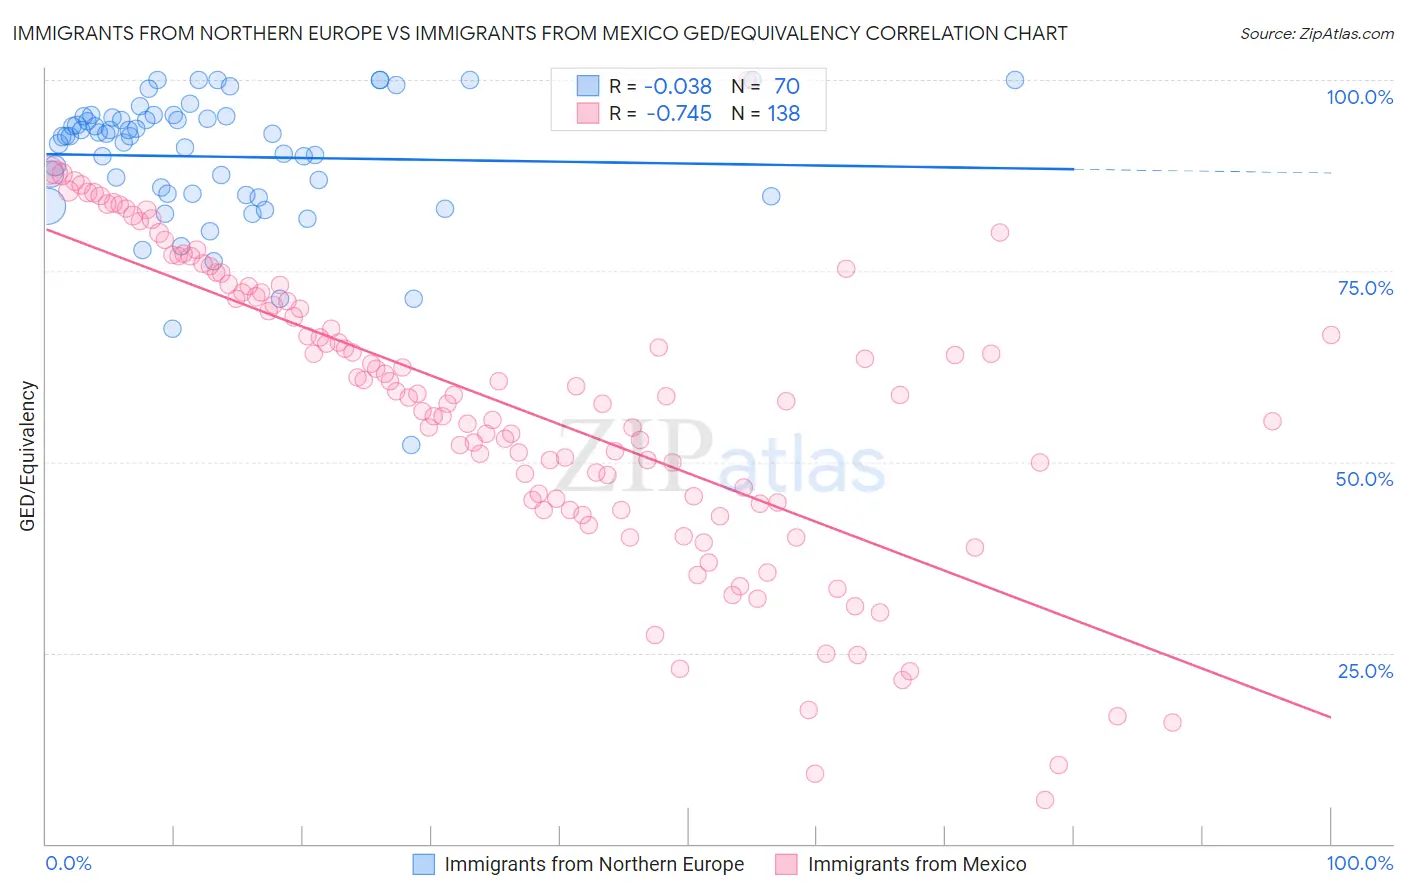
Immigrants from Northern Europe vs Immigrants from Mexico GED/Equivalency Correlation Chart
The statistical analysis conducted on geographies consisting of 477,226,871 people shows no correlation between the proportion of Immigrants from Northern Europe and percentage of population with at least ged/equivalency education in the United States with a correlation coefficient (R) of -0.038 and weighted average of 88.5%. Similarly, the statistical analysis conducted on geographies consisting of 513,765,067 people shows a strong negative correlation between the proportion of Immigrants from Mexico and percentage of population with at least ged/equivalency education in the United States with a correlation coefficient (R) of -0.745 and weighted average of 75.7%, a difference of 17.0%.
GED/Equivalency Correlation Summary
| Measurement | Immigrants from Northern Europe | Immigrants from Mexico |
| Minimum | 52.3% | 5.7% |
| Maximum | 100.0% | 100.0% |
| Range | 47.7% | 94.3% |
| Mean | 90.0% | 57.5% |
| Median | 92.6% | 58.6% |
| Interquartile 25% (IQ1) | 85.1% | 45.0% |
| Interquartile 75% (IQ3) | 95.2% | 72.2% |
| Interquartile Range (IQR) | 10.2% | 27.3% |
| Standard Deviation (Sample) | 8.7% | 19.4% |
| Standard Deviation (Population) | 8.7% | 19.4% |
Similar Demographics by GED/Equivalency
Demographics Similar to Immigrants from Northern Europe by GED/Equivalency
In terms of ged/equivalency, the demographic groups most similar to Immigrants from Northern Europe are Polish (88.5%, a difference of 0.030%), Immigrants from Lithuania (88.6%, a difference of 0.040%), Turkish (88.5%, a difference of 0.050%), Russian (88.6%, a difference of 0.080%), and Slovak (88.6%, a difference of 0.080%).
| Demographics | Rating | Rank | GED/Equivalency |
| Luxembourgers | 99.8 /100 | #21 | Exceptional 88.6% |
| Immigrants | Ireland | 99.8 /100 | #22 | Exceptional 88.6% |
| Russians | 99.8 /100 | #23 | Exceptional 88.6% |
| Slovaks | 99.8 /100 | #24 | Exceptional 88.6% |
| Estonians | 99.8 /100 | #25 | Exceptional 88.6% |
| Immigrants | Australia | 99.8 /100 | #26 | Exceptional 88.6% |
| Immigrants | Lithuania | 99.8 /100 | #27 | Exceptional 88.6% |
| Immigrants | Northern Europe | 99.8 /100 | #28 | Exceptional 88.5% |
| Poles | 99.8 /100 | #29 | Exceptional 88.5% |
| Turks | 99.8 /100 | #30 | Exceptional 88.5% |
| Bhutanese | 99.8 /100 | #31 | Exceptional 88.4% |
| Danes | 99.8 /100 | #32 | Exceptional 88.4% |
| Immigrants | Sweden | 99.7 /100 | #33 | Exceptional 88.4% |
| Immigrants | Japan | 99.7 /100 | #34 | Exceptional 88.4% |
| Immigrants | South Central Asia | 99.7 /100 | #35 | Exceptional 88.4% |
Demographics Similar to Immigrants from Mexico by GED/Equivalency
In terms of ged/equivalency, the demographic groups most similar to Immigrants from Mexico are Spanish American Indian (76.3%, a difference of 0.89%), Immigrants from Central America (76.4%, a difference of 0.92%), Houma (75.0%, a difference of 0.94%), Pima (76.4%, a difference of 1.0%), and Yakama (74.5%, a difference of 1.6%).
| Demographics | Rating | Rank | GED/Equivalency |
| Salvadorans | 0.0 /100 | #333 | Tragic 78.6% |
| Guatemalans | 0.0 /100 | #334 | Tragic 78.5% |
| Immigrants | Latin America | 0.0 /100 | #335 | Tragic 78.5% |
| Immigrants | Dominican Republic | 0.0 /100 | #336 | Tragic 78.0% |
| Immigrants | Yemen | 0.0 /100 | #337 | Tragic 77.9% |
| Immigrants | Guatemala | 0.0 /100 | #338 | Tragic 77.9% |
| Immigrants | El Salvador | 0.0 /100 | #339 | Tragic 77.6% |
| Tohono O'odham | 0.0 /100 | #340 | Tragic 77.5% |
| Mexicans | 0.0 /100 | #341 | Tragic 77.4% |
| Pima | 0.0 /100 | #342 | Tragic 76.4% |
| Immigrants | Central America | 0.0 /100 | #343 | Tragic 76.4% |
| Spanish American Indians | 0.0 /100 | #344 | Tragic 76.3% |
| Immigrants | Mexico | 0.0 /100 | #345 | Tragic 75.7% |
| Houma | 0.0 /100 | #346 | Tragic 75.0% |
| Yakama | 0.0 /100 | #347 | Tragic 74.5% |