Immigrants from Northern Europe vs Seminole GED/Equivalency
COMPARE
Immigrants from Northern Europe
Seminole
GED/Equivalency
GED/Equivalency Comparison
Immigrants from Northern Europe
Seminole
88.5%
GED/EQUIVALENCY
99.8/ 100
METRIC RATING
28th/ 347
METRIC RANK
82.8%
GED/EQUIVALENCY
0.1/ 100
METRIC RATING
275th/ 347
METRIC RANK
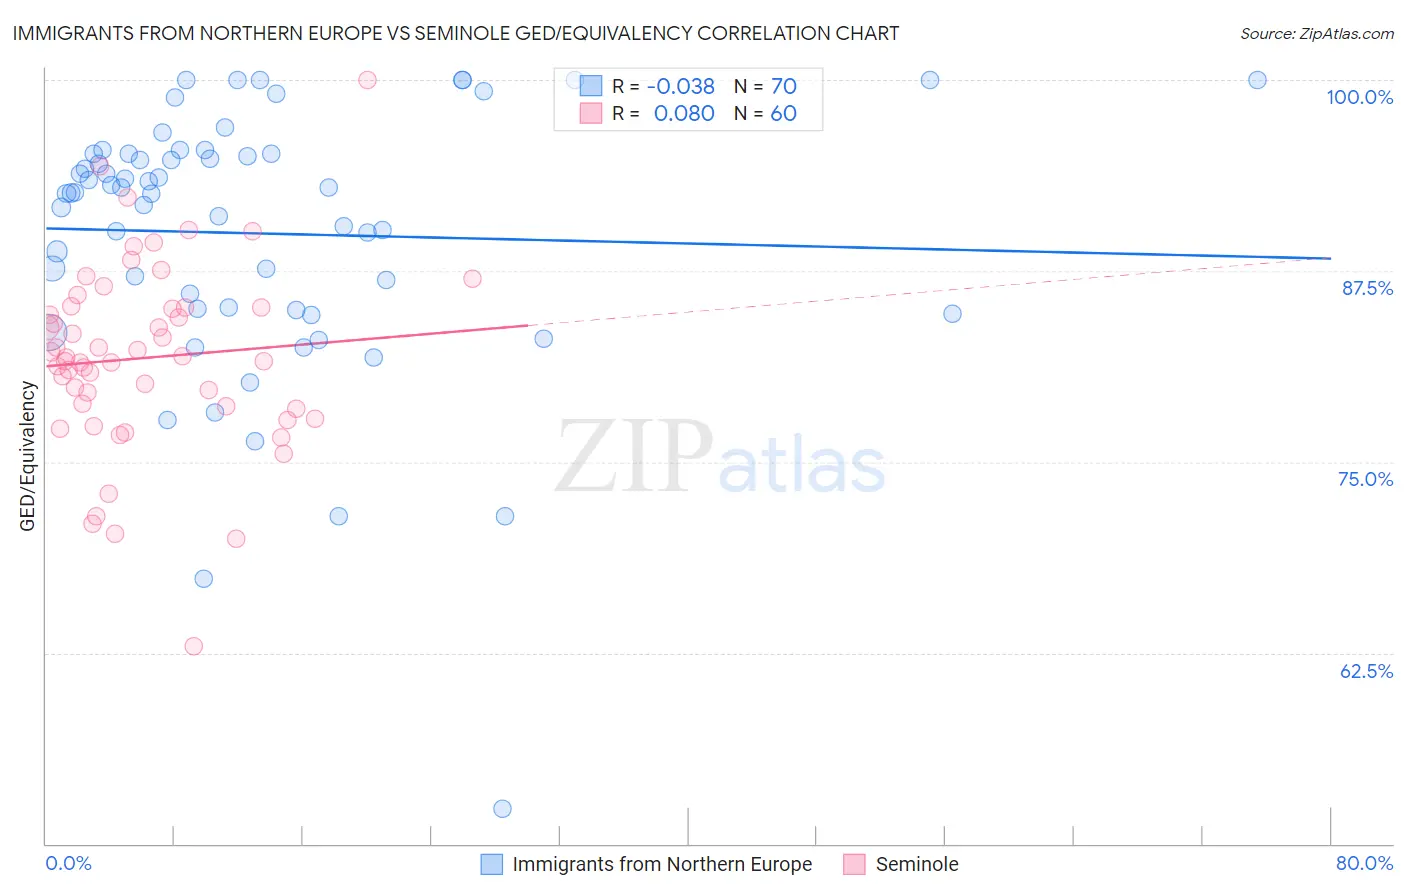
Immigrants from Northern Europe vs Seminole GED/Equivalency Correlation Chart
The statistical analysis conducted on geographies consisting of 477,226,871 people shows no correlation between the proportion of Immigrants from Northern Europe and percentage of population with at least ged/equivalency education in the United States with a correlation coefficient (R) of -0.038 and weighted average of 88.5%. Similarly, the statistical analysis conducted on geographies consisting of 118,314,162 people shows a slight positive correlation between the proportion of Seminole and percentage of population with at least ged/equivalency education in the United States with a correlation coefficient (R) of 0.080 and weighted average of 82.8%, a difference of 6.9%.
GED/Equivalency Correlation Summary
| Measurement | Immigrants from Northern Europe | Seminole |
| Minimum | 52.3% | 63.0% |
| Maximum | 100.0% | 100.0% |
| Range | 47.7% | 37.0% |
| Mean | 90.0% | 81.8% |
| Median | 92.6% | 81.7% |
| Interquartile 25% (IQ1) | 85.1% | 78.5% |
| Interquartile 75% (IQ3) | 95.2% | 85.1% |
| Interquartile Range (IQR) | 10.2% | 6.5% |
| Standard Deviation (Sample) | 8.7% | 6.2% |
| Standard Deviation (Population) | 8.7% | 6.1% |
Similar Demographics by GED/Equivalency
Demographics Similar to Immigrants from Northern Europe by GED/Equivalency
In terms of ged/equivalency, the demographic groups most similar to Immigrants from Northern Europe are Polish (88.5%, a difference of 0.030%), Immigrants from Lithuania (88.6%, a difference of 0.040%), Turkish (88.5%, a difference of 0.050%), Russian (88.6%, a difference of 0.080%), and Slovak (88.6%, a difference of 0.080%).
| Demographics | Rating | Rank | GED/Equivalency |
| Luxembourgers | 99.8 /100 | #21 | Exceptional 88.6% |
| Immigrants | Ireland | 99.8 /100 | #22 | Exceptional 88.6% |
| Russians | 99.8 /100 | #23 | Exceptional 88.6% |
| Slovaks | 99.8 /100 | #24 | Exceptional 88.6% |
| Estonians | 99.8 /100 | #25 | Exceptional 88.6% |
| Immigrants | Australia | 99.8 /100 | #26 | Exceptional 88.6% |
| Immigrants | Lithuania | 99.8 /100 | #27 | Exceptional 88.6% |
| Immigrants | Northern Europe | 99.8 /100 | #28 | Exceptional 88.5% |
| Poles | 99.8 /100 | #29 | Exceptional 88.5% |
| Turks | 99.8 /100 | #30 | Exceptional 88.5% |
| Bhutanese | 99.8 /100 | #31 | Exceptional 88.4% |
| Danes | 99.8 /100 | #32 | Exceptional 88.4% |
| Immigrants | Sweden | 99.7 /100 | #33 | Exceptional 88.4% |
| Immigrants | Japan | 99.7 /100 | #34 | Exceptional 88.4% |
| Immigrants | South Central Asia | 99.7 /100 | #35 | Exceptional 88.4% |
Demographics Similar to Seminole by GED/Equivalency
In terms of ged/equivalency, the demographic groups most similar to Seminole are Black/African American (82.8%, a difference of 0.020%), Arapaho (82.8%, a difference of 0.040%), Immigrants from Trinidad and Tobago (82.8%, a difference of 0.060%), Immigrants from Laos (82.7%, a difference of 0.070%), and Pennsylvania German (82.9%, a difference of 0.080%).
| Demographics | Rating | Rank | GED/Equivalency |
| Immigrants | Burma/Myanmar | 0.2 /100 | #268 | Tragic 83.0% |
| Hopi | 0.2 /100 | #269 | Tragic 83.0% |
| Immigrants | Jamaica | 0.2 /100 | #270 | Tragic 82.9% |
| U.S. Virgin Islanders | 0.2 /100 | #271 | Tragic 82.9% |
| Barbadians | 0.1 /100 | #272 | Tragic 82.9% |
| Pennsylvania Germans | 0.1 /100 | #273 | Tragic 82.9% |
| Immigrants | Trinidad and Tobago | 0.1 /100 | #274 | Tragic 82.8% |
| Seminole | 0.1 /100 | #275 | Tragic 82.8% |
| Blacks/African Americans | 0.1 /100 | #276 | Tragic 82.8% |
| Arapaho | 0.1 /100 | #277 | Tragic 82.8% |
| Immigrants | Laos | 0.1 /100 | #278 | Tragic 82.7% |
| Immigrants | Fiji | 0.1 /100 | #279 | Tragic 82.7% |
| Cheyenne | 0.1 /100 | #280 | Tragic 82.7% |
| Sioux | 0.1 /100 | #281 | Tragic 82.6% |
| Immigrants | Immigrants | 0.1 /100 | #282 | Tragic 82.6% |