Immigrants from Northern Europe vs Malaysian GED/Equivalency
COMPARE
Immigrants from Northern Europe
Malaysian
GED/Equivalency
GED/Equivalency Comparison
Immigrants from Northern Europe
Malaysians
88.5%
GED/EQUIVALENCY
99.8/ 100
METRIC RATING
28th/ 347
METRIC RANK
83.3%
GED/EQUIVALENCY
0.4/ 100
METRIC RATING
258th/ 347
METRIC RANK
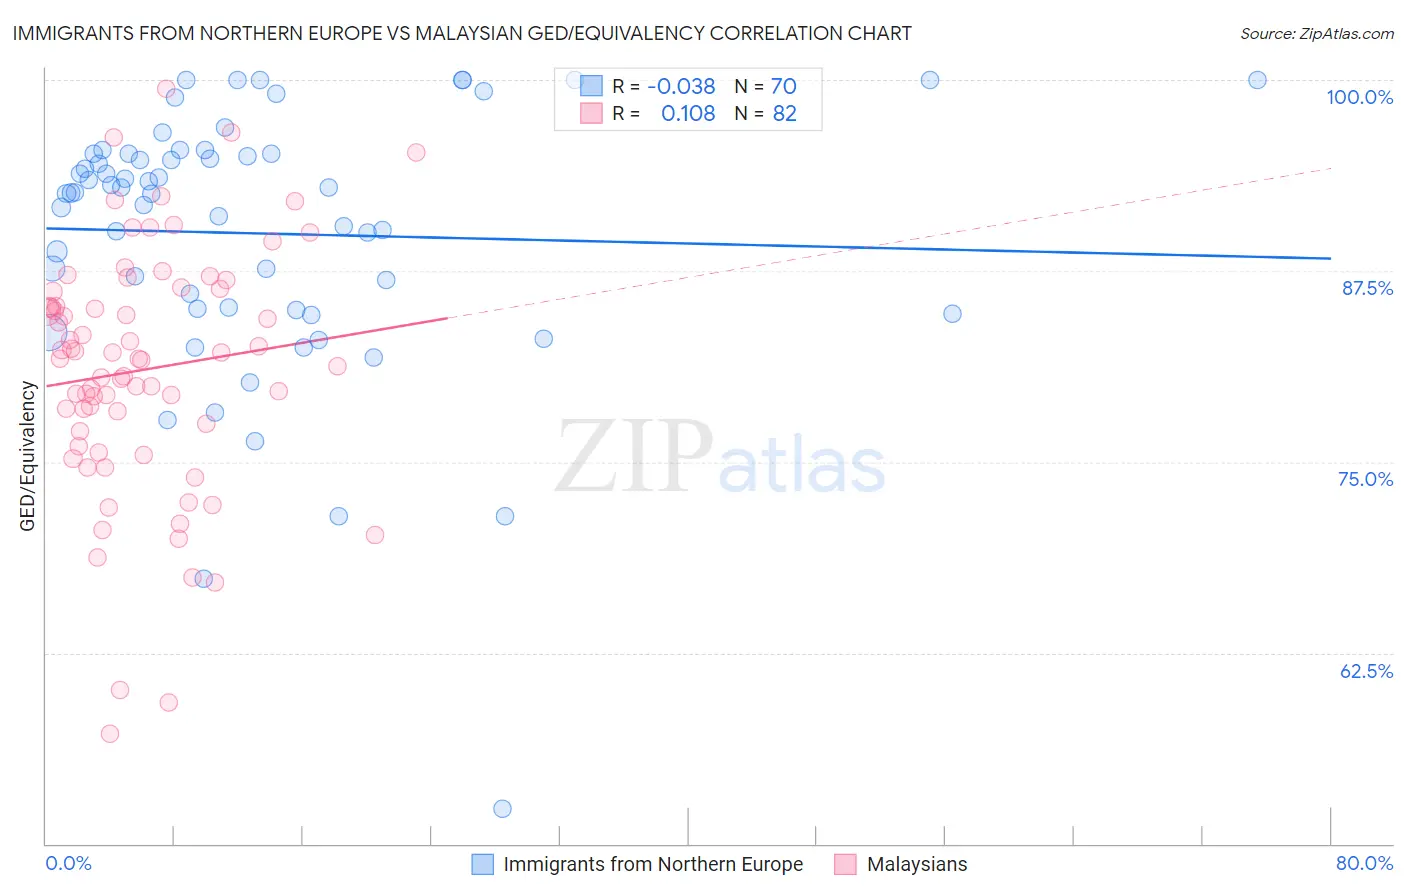
Immigrants from Northern Europe vs Malaysian GED/Equivalency Correlation Chart
The statistical analysis conducted on geographies consisting of 477,226,871 people shows no correlation between the proportion of Immigrants from Northern Europe and percentage of population with at least ged/equivalency education in the United States with a correlation coefficient (R) of -0.038 and weighted average of 88.5%. Similarly, the statistical analysis conducted on geographies consisting of 226,108,706 people shows a poor positive correlation between the proportion of Malaysians and percentage of population with at least ged/equivalency education in the United States with a correlation coefficient (R) of 0.108 and weighted average of 83.3%, a difference of 6.3%.
GED/Equivalency Correlation Summary
| Measurement | Immigrants from Northern Europe | Malaysian |
| Minimum | 52.3% | 57.2% |
| Maximum | 100.0% | 99.4% |
| Range | 47.7% | 42.2% |
| Mean | 90.0% | 81.0% |
| Median | 92.6% | 81.7% |
| Interquartile 25% (IQ1) | 85.1% | 77.0% |
| Interquartile 75% (IQ3) | 95.2% | 86.1% |
| Interquartile Range (IQR) | 10.2% | 9.2% |
| Standard Deviation (Sample) | 8.7% | 8.1% |
| Standard Deviation (Population) | 8.7% | 8.0% |
Similar Demographics by GED/Equivalency
Demographics Similar to Immigrants from Northern Europe by GED/Equivalency
In terms of ged/equivalency, the demographic groups most similar to Immigrants from Northern Europe are Polish (88.5%, a difference of 0.030%), Immigrants from Lithuania (88.6%, a difference of 0.040%), Turkish (88.5%, a difference of 0.050%), Russian (88.6%, a difference of 0.080%), and Slovak (88.6%, a difference of 0.080%).
| Demographics | Rating | Rank | GED/Equivalency |
| Luxembourgers | 99.8 /100 | #21 | Exceptional 88.6% |
| Immigrants | Ireland | 99.8 /100 | #22 | Exceptional 88.6% |
| Russians | 99.8 /100 | #23 | Exceptional 88.6% |
| Slovaks | 99.8 /100 | #24 | Exceptional 88.6% |
| Estonians | 99.8 /100 | #25 | Exceptional 88.6% |
| Immigrants | Australia | 99.8 /100 | #26 | Exceptional 88.6% |
| Immigrants | Lithuania | 99.8 /100 | #27 | Exceptional 88.6% |
| Immigrants | Northern Europe | 99.8 /100 | #28 | Exceptional 88.5% |
| Poles | 99.8 /100 | #29 | Exceptional 88.5% |
| Turks | 99.8 /100 | #30 | Exceptional 88.5% |
| Bhutanese | 99.8 /100 | #31 | Exceptional 88.4% |
| Danes | 99.8 /100 | #32 | Exceptional 88.4% |
| Immigrants | Sweden | 99.7 /100 | #33 | Exceptional 88.4% |
| Immigrants | Japan | 99.7 /100 | #34 | Exceptional 88.4% |
| Immigrants | South Central Asia | 99.7 /100 | #35 | Exceptional 88.4% |
Demographics Similar to Malaysians by GED/Equivalency
In terms of ged/equivalency, the demographic groups most similar to Malaysians are Jamaican (83.3%, a difference of 0.030%), Immigrants from Vietnam (83.2%, a difference of 0.14%), African (83.4%, a difference of 0.16%), Colville (83.4%, a difference of 0.17%), and Choctaw (83.1%, a difference of 0.17%).
| Demographics | Rating | Rank | GED/Equivalency |
| Spanish Americans | 0.8 /100 | #251 | Tragic 83.6% |
| Bahamians | 0.8 /100 | #252 | Tragic 83.6% |
| Comanche | 0.7 /100 | #253 | Tragic 83.6% |
| Creek | 0.7 /100 | #254 | Tragic 83.6% |
| Colville | 0.5 /100 | #255 | Tragic 83.4% |
| Africans | 0.5 /100 | #256 | Tragic 83.4% |
| Jamaicans | 0.4 /100 | #257 | Tragic 83.3% |
| Malaysians | 0.4 /100 | #258 | Tragic 83.3% |
| Immigrants | Vietnam | 0.3 /100 | #259 | Tragic 83.2% |
| Choctaw | 0.3 /100 | #260 | Tragic 83.1% |
| Inupiat | 0.2 /100 | #261 | Tragic 83.1% |
| Immigrants | Armenia | 0.2 /100 | #262 | Tragic 83.1% |
| Immigrants | Congo | 0.2 /100 | #263 | Tragic 83.1% |
| Bangladeshis | 0.2 /100 | #264 | Tragic 83.1% |
| West Indians | 0.2 /100 | #265 | Tragic 83.1% |