Immigrants from Northern Europe vs Zimbabwean GED/Equivalency
COMPARE
Immigrants from Northern Europe
Zimbabwean
GED/Equivalency
GED/Equivalency Comparison
Immigrants from Northern Europe
Zimbabweans
88.5%
GED/EQUIVALENCY
99.8/ 100
METRIC RATING
28th/ 347
METRIC RANK
88.0%
GED/EQUIVALENCY
99.4/ 100
METRIC RATING
52nd/ 347
METRIC RANK
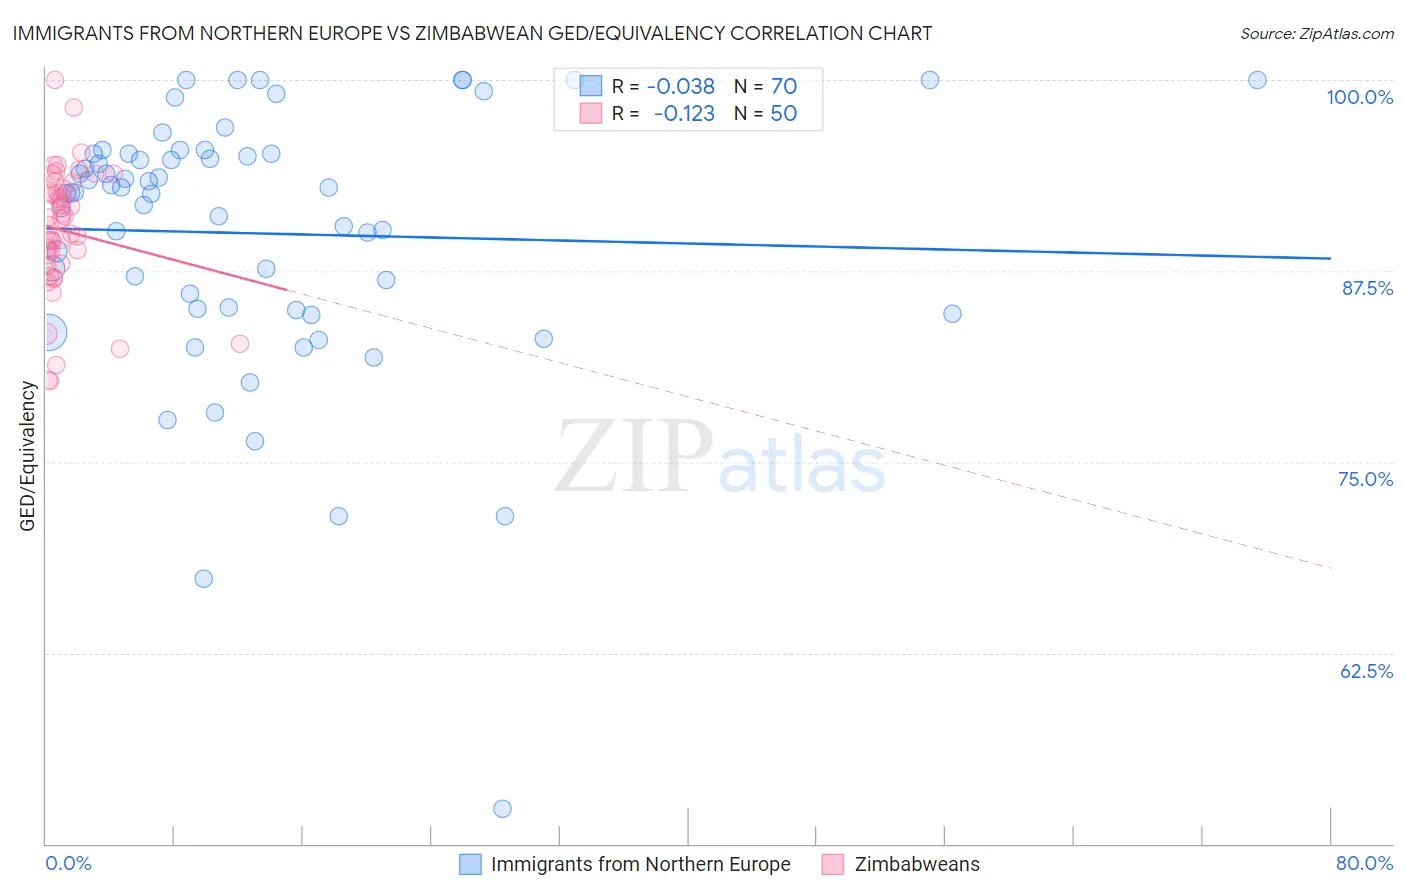
Immigrants from Northern Europe vs Zimbabwean GED/Equivalency Correlation Chart
The statistical analysis conducted on geographies consisting of 477,226,871 people shows no correlation between the proportion of Immigrants from Northern Europe and percentage of population with at least ged/equivalency education in the United States with a correlation coefficient (R) of -0.038 and weighted average of 88.5%. Similarly, the statistical analysis conducted on geographies consisting of 69,202,202 people shows a poor negative correlation between the proportion of Zimbabweans and percentage of population with at least ged/equivalency education in the United States with a correlation coefficient (R) of -0.123 and weighted average of 88.0%, a difference of 0.58%.
GED/Equivalency Correlation Summary
| Measurement | Immigrants from Northern Europe | Zimbabwean |
| Minimum | 52.3% | 80.3% |
| Maximum | 100.0% | 100.0% |
| Range | 47.7% | 19.7% |
| Mean | 90.0% | 90.1% |
| Median | 92.6% | 90.7% |
| Interquartile 25% (IQ1) | 85.1% | 88.0% |
| Interquartile 75% (IQ3) | 95.2% | 92.9% |
| Interquartile Range (IQR) | 10.2% | 4.9% |
| Standard Deviation (Sample) | 8.7% | 4.2% |
| Standard Deviation (Population) | 8.7% | 4.2% |
Similar Demographics by GED/Equivalency
Demographics Similar to Immigrants from Northern Europe by GED/Equivalency
In terms of ged/equivalency, the demographic groups most similar to Immigrants from Northern Europe are Polish (88.5%, a difference of 0.030%), Immigrants from Lithuania (88.6%, a difference of 0.040%), Turkish (88.5%, a difference of 0.050%), Russian (88.6%, a difference of 0.080%), and Slovak (88.6%, a difference of 0.080%).
| Demographics | Rating | Rank | GED/Equivalency |
| Luxembourgers | 99.8 /100 | #21 | Exceptional 88.6% |
| Immigrants | Ireland | 99.8 /100 | #22 | Exceptional 88.6% |
| Russians | 99.8 /100 | #23 | Exceptional 88.6% |
| Slovaks | 99.8 /100 | #24 | Exceptional 88.6% |
| Estonians | 99.8 /100 | #25 | Exceptional 88.6% |
| Immigrants | Australia | 99.8 /100 | #26 | Exceptional 88.6% |
| Immigrants | Lithuania | 99.8 /100 | #27 | Exceptional 88.6% |
| Immigrants | Northern Europe | 99.8 /100 | #28 | Exceptional 88.5% |
| Poles | 99.8 /100 | #29 | Exceptional 88.5% |
| Turks | 99.8 /100 | #30 | Exceptional 88.5% |
| Bhutanese | 99.8 /100 | #31 | Exceptional 88.4% |
| Danes | 99.8 /100 | #32 | Exceptional 88.4% |
| Immigrants | Sweden | 99.7 /100 | #33 | Exceptional 88.4% |
| Immigrants | Japan | 99.7 /100 | #34 | Exceptional 88.4% |
| Immigrants | South Central Asia | 99.7 /100 | #35 | Exceptional 88.4% |
Demographics Similar to Zimbabweans by GED/Equivalency
In terms of ged/equivalency, the demographic groups most similar to Zimbabweans are Immigrants from Netherlands (88.0%, a difference of 0.0%), Immigrants from South Africa (88.0%, a difference of 0.0%), Soviet Union (88.0%, a difference of 0.010%), New Zealander (88.0%, a difference of 0.010%), and Immigrants from Denmark (88.0%, a difference of 0.030%).
| Demographics | Rating | Rank | GED/Equivalency |
| Czechs | 99.5 /100 | #45 | Exceptional 88.1% |
| Immigrants | Switzerland | 99.5 /100 | #46 | Exceptional 88.1% |
| Immigrants | Latvia | 99.5 /100 | #47 | Exceptional 88.1% |
| Greeks | 99.5 /100 | #48 | Exceptional 88.1% |
| Australians | 99.5 /100 | #49 | Exceptional 88.1% |
| Immigrants | Korea | 99.5 /100 | #50 | Exceptional 88.1% |
| Immigrants | Netherlands | 99.4 /100 | #51 | Exceptional 88.0% |
| Zimbabweans | 99.4 /100 | #52 | Exceptional 88.0% |
| Immigrants | South Africa | 99.4 /100 | #53 | Exceptional 88.0% |
| Soviet Union | 99.4 /100 | #54 | Exceptional 88.0% |
| New Zealanders | 99.4 /100 | #55 | Exceptional 88.0% |
| Immigrants | Denmark | 99.4 /100 | #56 | Exceptional 88.0% |
| Immigrants | Czechoslovakia | 99.3 /100 | #57 | Exceptional 87.9% |
| Northern Europeans | 99.3 /100 | #58 | Exceptional 87.9% |
| Serbians | 99.3 /100 | #59 | Exceptional 87.9% |