Immigrants from Northern Europe vs Immigrants from Chile GED/Equivalency
COMPARE
Immigrants from Northern Europe
Immigrants from Chile
GED/Equivalency
GED/Equivalency Comparison
Immigrants from Northern Europe
Immigrants from Chile
88.5%
GED/EQUIVALENCY
99.8/ 100
METRIC RATING
28th/ 347
METRIC RANK
85.9%
GED/EQUIVALENCY
57.3/ 100
METRIC RATING
171st/ 347
METRIC RANK
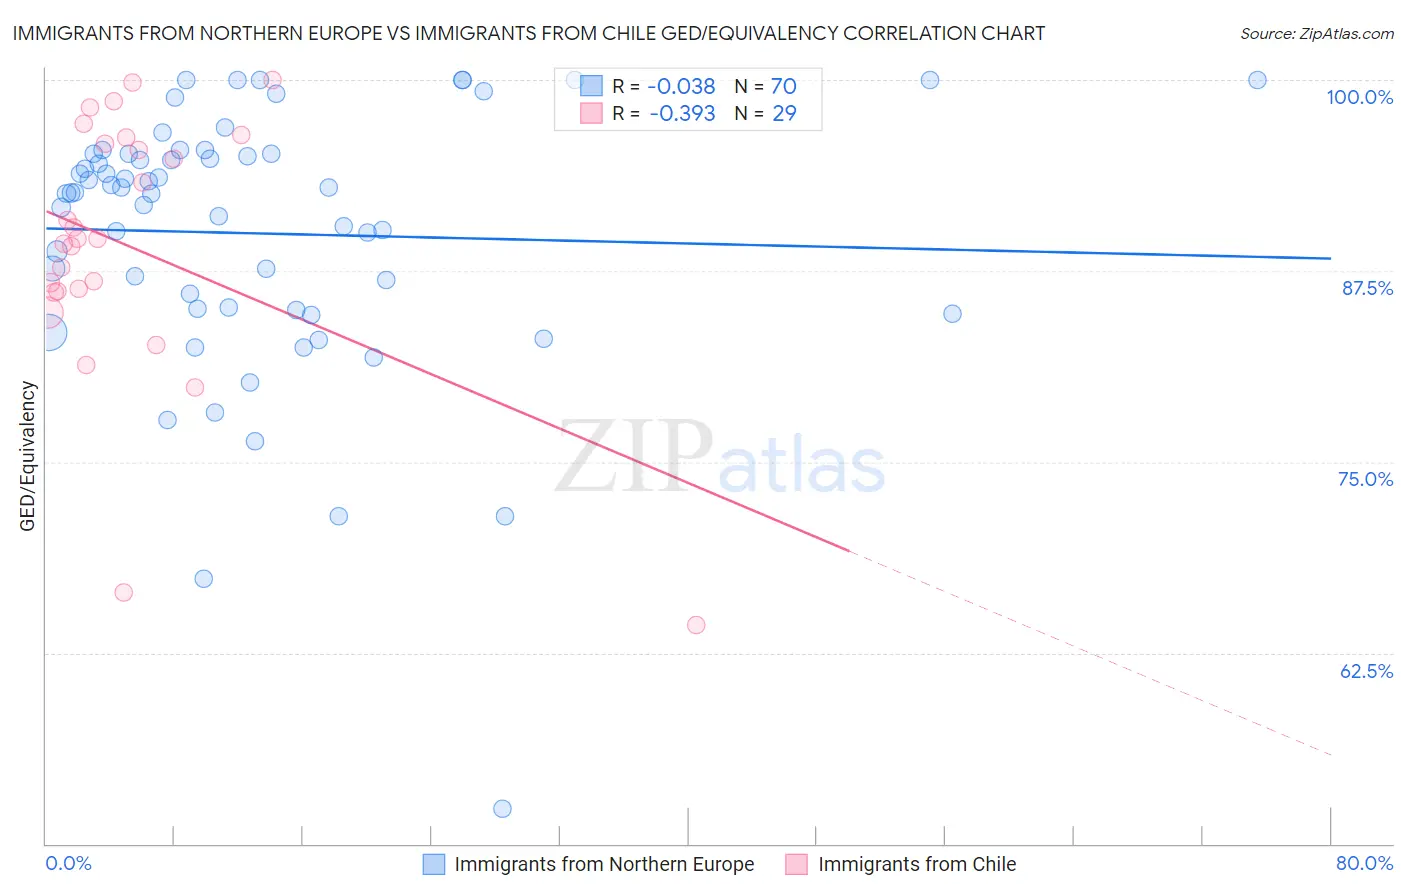
Immigrants from Northern Europe vs Immigrants from Chile GED/Equivalency Correlation Chart
The statistical analysis conducted on geographies consisting of 477,226,871 people shows no correlation between the proportion of Immigrants from Northern Europe and percentage of population with at least ged/equivalency education in the United States with a correlation coefficient (R) of -0.038 and weighted average of 88.5%. Similarly, the statistical analysis conducted on geographies consisting of 218,647,266 people shows a mild negative correlation between the proportion of Immigrants from Chile and percentage of population with at least ged/equivalency education in the United States with a correlation coefficient (R) of -0.393 and weighted average of 85.9%, a difference of 3.1%.
GED/Equivalency Correlation Summary
| Measurement | Immigrants from Northern Europe | Immigrants from Chile |
| Minimum | 52.3% | 64.3% |
| Maximum | 100.0% | 100.0% |
| Range | 47.7% | 35.7% |
| Mean | 90.0% | 89.1% |
| Median | 92.6% | 89.6% |
| Interquartile 25% (IQ1) | 85.1% | 86.1% |
| Interquartile 75% (IQ3) | 95.2% | 96.0% |
| Interquartile Range (IQR) | 10.2% | 9.8% |
| Standard Deviation (Sample) | 8.7% | 8.6% |
| Standard Deviation (Population) | 8.7% | 8.5% |
Similar Demographics by GED/Equivalency
Demographics Similar to Immigrants from Northern Europe by GED/Equivalency
In terms of ged/equivalency, the demographic groups most similar to Immigrants from Northern Europe are Polish (88.5%, a difference of 0.030%), Immigrants from Lithuania (88.6%, a difference of 0.040%), Turkish (88.5%, a difference of 0.050%), Russian (88.6%, a difference of 0.080%), and Slovak (88.6%, a difference of 0.080%).
| Demographics | Rating | Rank | GED/Equivalency |
| Luxembourgers | 99.8 /100 | #21 | Exceptional 88.6% |
| Immigrants | Ireland | 99.8 /100 | #22 | Exceptional 88.6% |
| Russians | 99.8 /100 | #23 | Exceptional 88.6% |
| Slovaks | 99.8 /100 | #24 | Exceptional 88.6% |
| Estonians | 99.8 /100 | #25 | Exceptional 88.6% |
| Immigrants | Australia | 99.8 /100 | #26 | Exceptional 88.6% |
| Immigrants | Lithuania | 99.8 /100 | #27 | Exceptional 88.6% |
| Immigrants | Northern Europe | 99.8 /100 | #28 | Exceptional 88.5% |
| Poles | 99.8 /100 | #29 | Exceptional 88.5% |
| Turks | 99.8 /100 | #30 | Exceptional 88.5% |
| Bhutanese | 99.8 /100 | #31 | Exceptional 88.4% |
| Danes | 99.8 /100 | #32 | Exceptional 88.4% |
| Immigrants | Sweden | 99.7 /100 | #33 | Exceptional 88.4% |
| Immigrants | Japan | 99.7 /100 | #34 | Exceptional 88.4% |
| Immigrants | South Central Asia | 99.7 /100 | #35 | Exceptional 88.4% |
Demographics Similar to Immigrants from Chile by GED/Equivalency
In terms of ged/equivalency, the demographic groups most similar to Immigrants from Chile are Afghan (85.9%, a difference of 0.050%), Bermudan (85.8%, a difference of 0.050%), Immigrants from Ethiopia (86.0%, a difference of 0.080%), Sierra Leonean (86.0%, a difference of 0.10%), and Ethiopian (86.0%, a difference of 0.14%).
| Demographics | Rating | Rank | GED/Equivalency |
| Venezuelans | 65.5 /100 | #164 | Good 86.0% |
| Alsatians | 64.3 /100 | #165 | Good 86.0% |
| Immigrants | Albania | 64.2 /100 | #166 | Good 86.0% |
| Ethiopians | 63.7 /100 | #167 | Good 86.0% |
| Sierra Leoneans | 61.8 /100 | #168 | Good 86.0% |
| Immigrants | Ethiopia | 61.2 /100 | #169 | Good 86.0% |
| Afghans | 59.7 /100 | #170 | Average 85.9% |
| Immigrants | Chile | 57.3 /100 | #171 | Average 85.9% |
| Bermudans | 55.1 /100 | #172 | Average 85.8% |
| Immigrants | Venezuela | 50.7 /100 | #173 | Average 85.8% |
| Ottawa | 50.0 /100 | #174 | Average 85.8% |
| Immigrants | Bolivia | 49.8 /100 | #175 | Average 85.8% |
| Immigrants | Eastern Africa | 47.7 /100 | #176 | Average 85.7% |
| Immigrants | Uganda | 45.2 /100 | #177 | Average 85.7% |
| Koreans | 41.2 /100 | #178 | Average 85.6% |