Immigrants from Northern Europe vs Immigrants from Mexico In Labor Force | Age 20-64
COMPARE
Immigrants from Northern Europe
Immigrants from Mexico
In Labor Force | Age 20-64
In Labor Force | Age 20-64 Comparison
Immigrants from Northern Europe
Immigrants from Mexico
79.7%
IN LABOR FORCE | AGE 20-64
72.0/ 100
METRIC RATING
152nd/ 347
METRIC RANK
77.3%
IN LABOR FORCE | AGE 20-64
0.0/ 100
METRIC RATING
304th/ 347
METRIC RANK
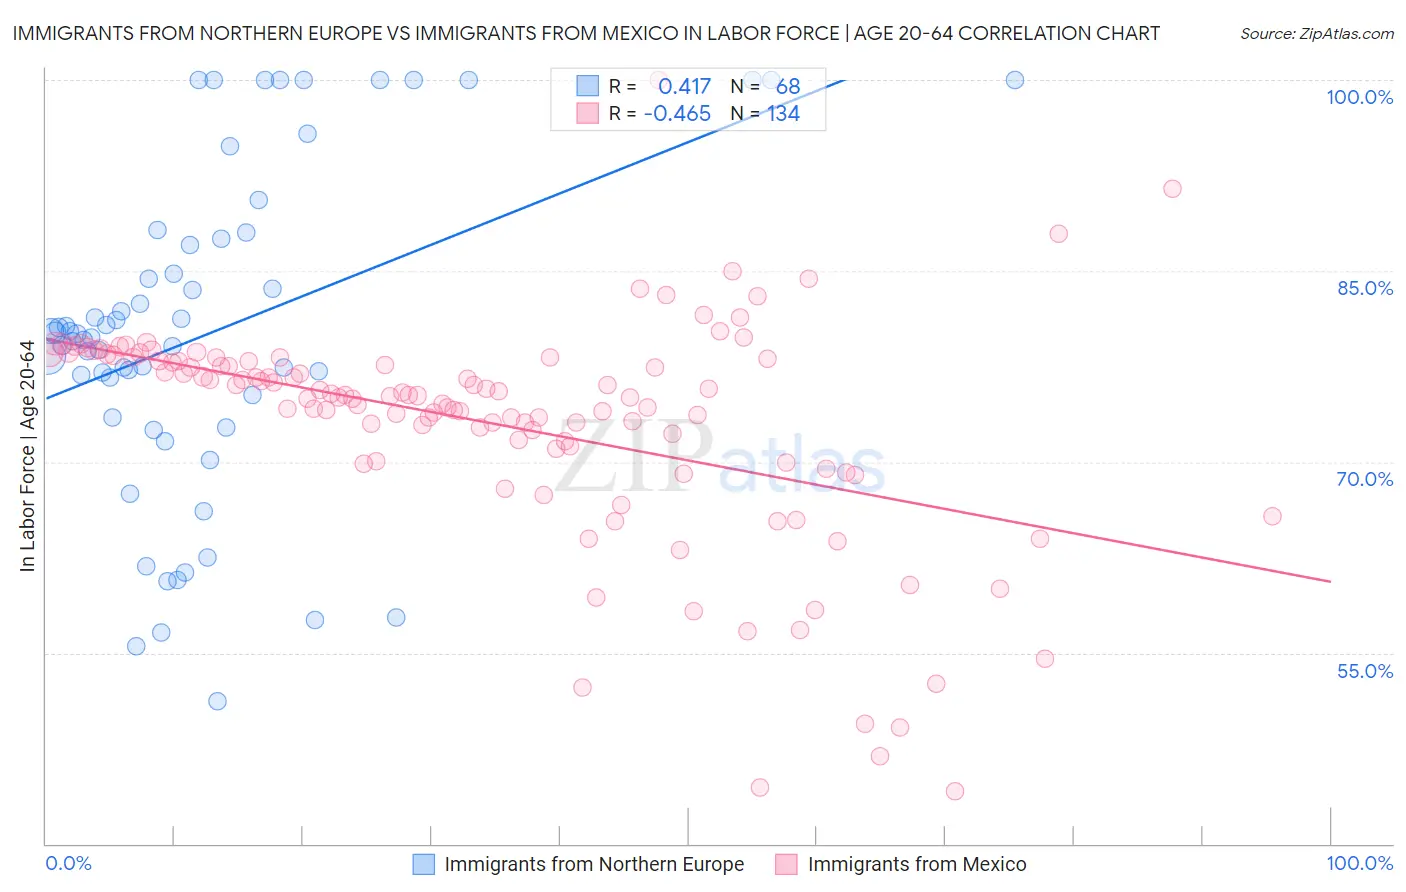
Immigrants from Northern Europe vs Immigrants from Mexico In Labor Force | Age 20-64 Correlation Chart
The statistical analysis conducted on geographies consisting of 477,244,131 people shows a moderate positive correlation between the proportion of Immigrants from Northern Europe and labor force participation rate among population between the ages 20 and 64 in the United States with a correlation coefficient (R) of 0.417 and weighted average of 79.7%. Similarly, the statistical analysis conducted on geographies consisting of 513,715,618 people shows a moderate negative correlation between the proportion of Immigrants from Mexico and labor force participation rate among population between the ages 20 and 64 in the United States with a correlation coefficient (R) of -0.465 and weighted average of 77.3%, a difference of 3.2%.
In Labor Force | Age 20-64 Correlation Summary
| Measurement | Immigrants from Northern Europe | Immigrants from Mexico |
| Minimum | 51.2% | 44.1% |
| Maximum | 100.0% | 100.0% |
| Range | 48.8% | 55.9% |
| Mean | 80.1% | 73.0% |
| Median | 79.9% | 75.2% |
| Interquartile 25% (IQ1) | 74.4% | 71.0% |
| Interquartile 75% (IQ3) | 87.3% | 78.1% |
| Interquartile Range (IQR) | 12.9% | 7.1% |
| Standard Deviation (Sample) | 12.7% | 8.8% |
| Standard Deviation (Population) | 12.6% | 8.7% |
Similar Demographics by In Labor Force | Age 20-64
Demographics Similar to Immigrants from Northern Europe by In Labor Force | Age 20-64
In terms of in labor force | age 20-64, the demographic groups most similar to Immigrants from Northern Europe are Costa Rican (79.7%, a difference of 0.0%), Scandinavian (79.7%, a difference of 0.0%), Immigrants from Kazakhstan (79.7%, a difference of 0.020%), New Zealander (79.7%, a difference of 0.020%), and Icelander (79.7%, a difference of 0.030%).
| Demographics | Rating | Rank | In Labor Force | Age 20-64 |
| Pakistanis | 79.3 /100 | #145 | Good 79.8% |
| Immigrants | Southern Europe | 78.9 /100 | #146 | Good 79.8% |
| Immigrants | Philippines | 78.0 /100 | #147 | Good 79.8% |
| Romanians | 77.6 /100 | #148 | Good 79.8% |
| Icelanders | 75.1 /100 | #149 | Good 79.7% |
| Costa Ricans | 72.4 /100 | #150 | Good 79.7% |
| Scandinavians | 72.0 /100 | #151 | Good 79.7% |
| Immigrants | Northern Europe | 72.0 /100 | #152 | Good 79.7% |
| Immigrants | Kazakhstan | 69.5 /100 | #153 | Good 79.7% |
| New Zealanders | 69.4 /100 | #154 | Good 79.7% |
| Immigrants | South Africa | 69.2 /100 | #155 | Good 79.7% |
| Senegalese | 69.1 /100 | #156 | Good 79.7% |
| Immigrants | China | 69.1 /100 | #157 | Good 79.7% |
| Austrians | 67.6 /100 | #158 | Good 79.7% |
| Immigrants | Cuba | 66.7 /100 | #159 | Good 79.7% |
Demographics Similar to Immigrants from Mexico by In Labor Force | Age 20-64
In terms of in labor force | age 20-64, the demographic groups most similar to Immigrants from Mexico are Mexican (77.2%, a difference of 0.040%), Potawatomi (77.2%, a difference of 0.060%), Chippewa (77.3%, a difference of 0.070%), Central American Indian (77.1%, a difference of 0.23%), and Alaska Native (77.0%, a difference of 0.28%).
| Demographics | Rating | Rank | In Labor Force | Age 20-64 |
| Dominicans | 0.0 /100 | #297 | Tragic 77.7% |
| Cree | 0.0 /100 | #298 | Tragic 77.7% |
| Hispanics or Latinos | 0.0 /100 | #299 | Tragic 77.6% |
| Spanish American Indians | 0.0 /100 | #300 | Tragic 77.6% |
| Nepalese | 0.0 /100 | #301 | Tragic 77.5% |
| Iroquois | 0.0 /100 | #302 | Tragic 77.5% |
| Chippewa | 0.0 /100 | #303 | Tragic 77.3% |
| Immigrants | Mexico | 0.0 /100 | #304 | Tragic 77.3% |
| Mexicans | 0.0 /100 | #305 | Tragic 77.2% |
| Potawatomi | 0.0 /100 | #306 | Tragic 77.2% |
| Central American Indians | 0.0 /100 | #307 | Tragic 77.1% |
| Alaska Natives | 0.0 /100 | #308 | Tragic 77.0% |
| Americans | 0.0 /100 | #309 | Tragic 77.0% |
| Comanche | 0.0 /100 | #310 | Tragic 77.0% |
| Blackfeet | 0.0 /100 | #311 | Tragic 77.0% |