Immigrants from Northern Europe vs Chinese GED/Equivalency
COMPARE
Immigrants from Northern Europe
Chinese
GED/Equivalency
GED/Equivalency Comparison
Immigrants from Northern Europe
Chinese
88.5%
GED/EQUIVALENCY
99.8/ 100
METRIC RATING
28th/ 347
METRIC RANK
89.0%
GED/EQUIVALENCY
99.9/ 100
METRIC RATING
9th/ 347
METRIC RANK
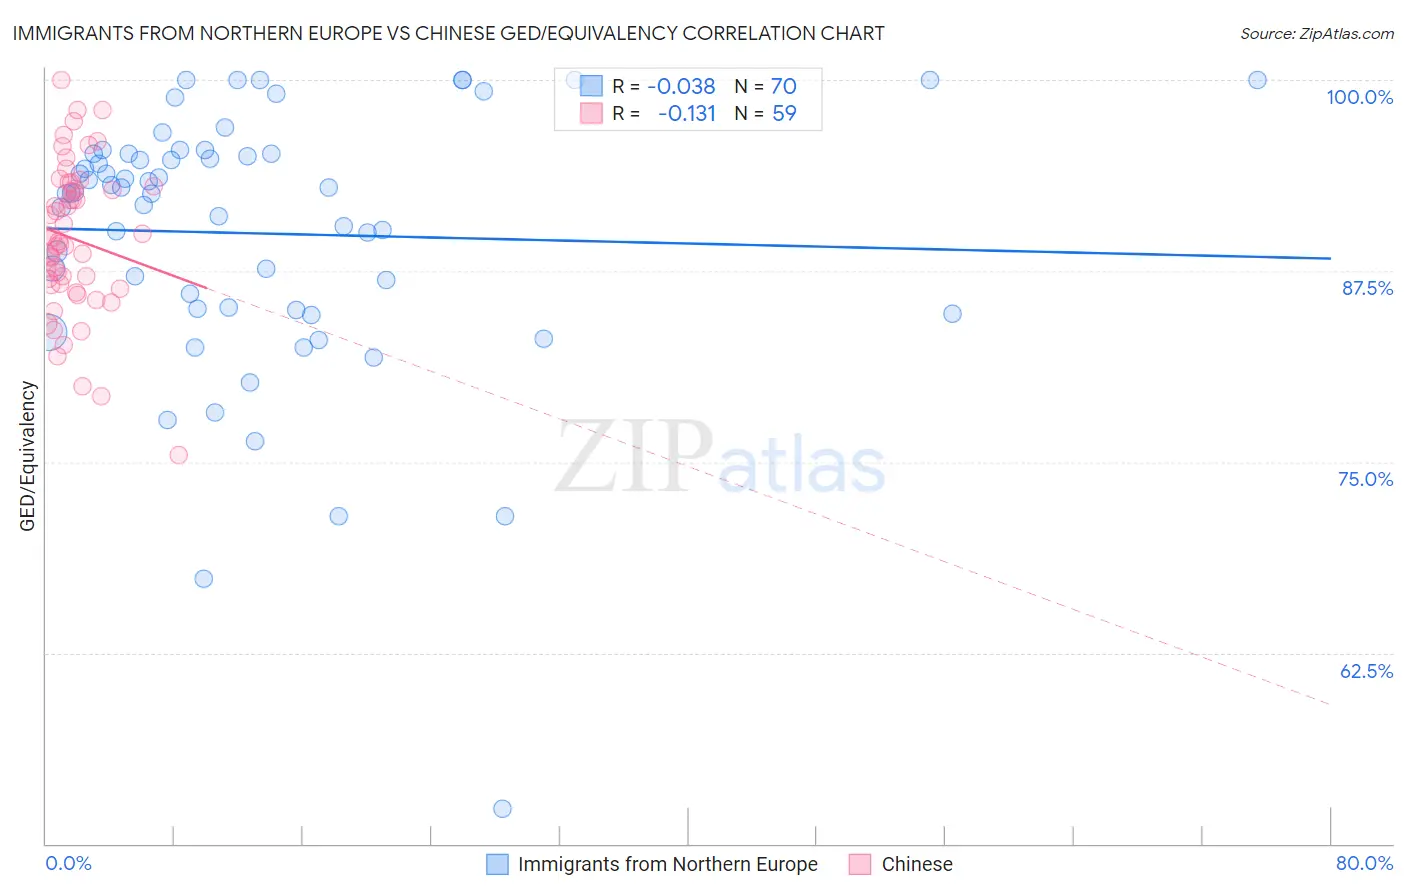
Immigrants from Northern Europe vs Chinese GED/Equivalency Correlation Chart
The statistical analysis conducted on geographies consisting of 477,226,871 people shows no correlation between the proportion of Immigrants from Northern Europe and percentage of population with at least ged/equivalency education in the United States with a correlation coefficient (R) of -0.038 and weighted average of 88.5%. Similarly, the statistical analysis conducted on geographies consisting of 64,809,883 people shows a poor negative correlation between the proportion of Chinese and percentage of population with at least ged/equivalency education in the United States with a correlation coefficient (R) of -0.131 and weighted average of 89.0%, a difference of 0.59%.
GED/Equivalency Correlation Summary
| Measurement | Immigrants from Northern Europe | Chinese |
| Minimum | 52.3% | 75.4% |
| Maximum | 100.0% | 100.0% |
| Range | 47.7% | 24.6% |
| Mean | 90.0% | 89.6% |
| Median | 92.6% | 89.4% |
| Interquartile 25% (IQ1) | 85.1% | 86.6% |
| Interquartile 75% (IQ3) | 95.2% | 93.0% |
| Interquartile Range (IQR) | 10.2% | 6.5% |
| Standard Deviation (Sample) | 8.7% | 4.9% |
| Standard Deviation (Population) | 8.7% | 4.9% |
Demographics Similar to Immigrants from Northern Europe and Chinese by GED/Equivalency
In terms of ged/equivalency, the demographic groups most similar to Immigrants from Northern Europe are Immigrants from Lithuania (88.6%, a difference of 0.040%), Russian (88.6%, a difference of 0.080%), Slovak (88.6%, a difference of 0.080%), Estonian (88.6%, a difference of 0.080%), and Immigrants from Australia (88.6%, a difference of 0.080%). Similarly, the demographic groups most similar to Chinese are Carpatho Rusyn (89.1%, a difference of 0.020%), Norwegian (89.0%, a difference of 0.040%), Bulgarian (89.0%, a difference of 0.080%), Lithuanian (88.9%, a difference of 0.12%), and Immigrants from Iran (88.9%, a difference of 0.13%).
| Demographics | Rating | Rank | GED/Equivalency |
| Carpatho Rusyns | 99.9 /100 | #8 | Exceptional 89.1% |
| Chinese | 99.9 /100 | #9 | Exceptional 89.0% |
| Norwegians | 99.9 /100 | #10 | Exceptional 89.0% |
| Bulgarians | 99.9 /100 | #11 | Exceptional 89.0% |
| Lithuanians | 99.9 /100 | #12 | Exceptional 88.9% |
| Immigrants | Iran | 99.9 /100 | #13 | Exceptional 88.9% |
| Cypriots | 99.9 /100 | #14 | Exceptional 88.9% |
| Okinawans | 99.9 /100 | #15 | Exceptional 88.9% |
| Immigrants | Taiwan | 99.9 /100 | #16 | Exceptional 88.8% |
| Croatians | 99.9 /100 | #17 | Exceptional 88.8% |
| Slovenes | 99.9 /100 | #18 | Exceptional 88.8% |
| Swedes | 99.9 /100 | #19 | Exceptional 88.8% |
| Maltese | 99.9 /100 | #20 | Exceptional 88.6% |
| Luxembourgers | 99.8 /100 | #21 | Exceptional 88.6% |
| Immigrants | Ireland | 99.8 /100 | #22 | Exceptional 88.6% |
| Russians | 99.8 /100 | #23 | Exceptional 88.6% |
| Slovaks | 99.8 /100 | #24 | Exceptional 88.6% |
| Estonians | 99.8 /100 | #25 | Exceptional 88.6% |
| Immigrants | Australia | 99.8 /100 | #26 | Exceptional 88.6% |
| Immigrants | Lithuania | 99.8 /100 | #27 | Exceptional 88.6% |
| Immigrants | Northern Europe | 99.8 /100 | #28 | Exceptional 88.5% |