Thai vs Immigrants from Chile GED/Equivalency
COMPARE
Thai
Immigrants from Chile
GED/Equivalency
GED/Equivalency Comparison
Thais
Immigrants from Chile
89.1%
GED/EQUIVALENCY
100.0/ 100
METRIC RATING
6th/ 347
METRIC RANK
85.9%
GED/EQUIVALENCY
57.3/ 100
METRIC RATING
171st/ 347
METRIC RANK
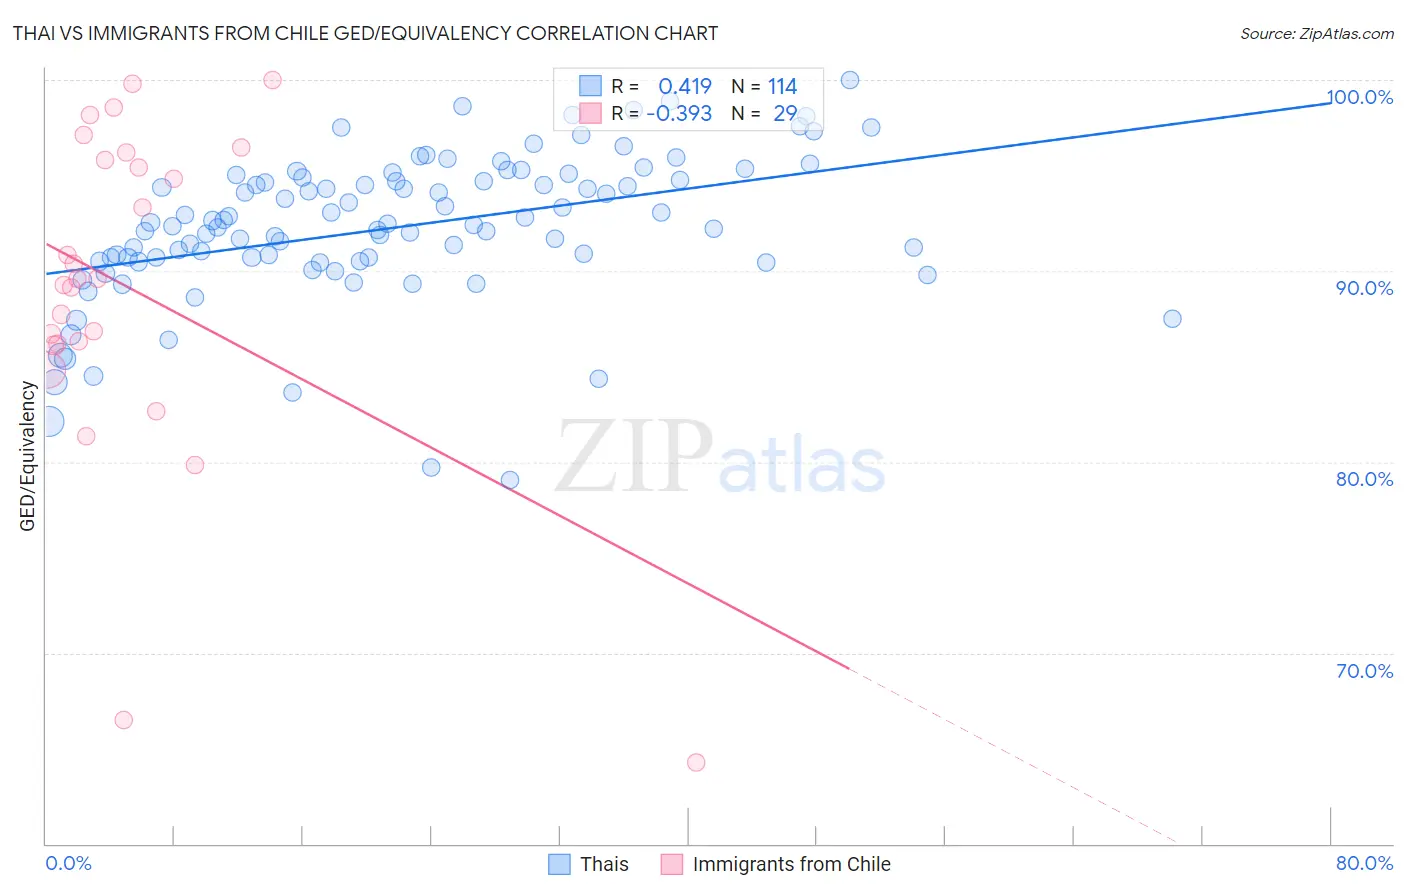
Thai vs Immigrants from Chile GED/Equivalency Correlation Chart
The statistical analysis conducted on geographies consisting of 475,814,962 people shows a moderate positive correlation between the proportion of Thais and percentage of population with at least ged/equivalency education in the United States with a correlation coefficient (R) of 0.419 and weighted average of 89.1%. Similarly, the statistical analysis conducted on geographies consisting of 218,647,266 people shows a mild negative correlation between the proportion of Immigrants from Chile and percentage of population with at least ged/equivalency education in the United States with a correlation coefficient (R) of -0.393 and weighted average of 85.9%, a difference of 3.8%.
GED/Equivalency Correlation Summary
| Measurement | Thai | Immigrants from Chile |
| Minimum | 79.0% | 64.3% |
| Maximum | 100.0% | 100.0% |
| Range | 21.0% | 35.7% |
| Mean | 92.3% | 89.1% |
| Median | 92.4% | 89.6% |
| Interquartile 25% (IQ1) | 90.5% | 86.1% |
| Interquartile 75% (IQ3) | 94.7% | 96.0% |
| Interquartile Range (IQR) | 4.2% | 9.8% |
| Standard Deviation (Sample) | 3.9% | 8.6% |
| Standard Deviation (Population) | 3.9% | 8.5% |
Similar Demographics by GED/Equivalency
Demographics Similar to Thais by GED/Equivalency
In terms of ged/equivalency, the demographic groups most similar to Thais are Latvian (89.2%, a difference of 0.020%), Eastern European (89.1%, a difference of 0.040%), Carpatho Rusyn (89.1%, a difference of 0.090%), Iranian (89.2%, a difference of 0.12%), and Chinese (89.0%, a difference of 0.12%).
| Demographics | Rating | Rank | GED/Equivalency |
| Immigrants | India | 100.0 /100 | #1 | Exceptional 89.7% |
| Filipinos | 100.0 /100 | #2 | Exceptional 89.5% |
| Immigrants | Singapore | 100.0 /100 | #3 | Exceptional 89.3% |
| Iranians | 100.0 /100 | #4 | Exceptional 89.2% |
| Latvians | 100.0 /100 | #5 | Exceptional 89.2% |
| Thais | 100.0 /100 | #6 | Exceptional 89.1% |
| Eastern Europeans | 99.9 /100 | #7 | Exceptional 89.1% |
| Carpatho Rusyns | 99.9 /100 | #8 | Exceptional 89.1% |
| Chinese | 99.9 /100 | #9 | Exceptional 89.0% |
| Norwegians | 99.9 /100 | #10 | Exceptional 89.0% |
| Bulgarians | 99.9 /100 | #11 | Exceptional 89.0% |
| Lithuanians | 99.9 /100 | #12 | Exceptional 88.9% |
| Immigrants | Iran | 99.9 /100 | #13 | Exceptional 88.9% |
| Cypriots | 99.9 /100 | #14 | Exceptional 88.9% |
| Okinawans | 99.9 /100 | #15 | Exceptional 88.9% |
Demographics Similar to Immigrants from Chile by GED/Equivalency
In terms of ged/equivalency, the demographic groups most similar to Immigrants from Chile are Afghan (85.9%, a difference of 0.050%), Bermudan (85.8%, a difference of 0.050%), Immigrants from Ethiopia (86.0%, a difference of 0.080%), Sierra Leonean (86.0%, a difference of 0.10%), and Ethiopian (86.0%, a difference of 0.14%).
| Demographics | Rating | Rank | GED/Equivalency |
| Venezuelans | 65.5 /100 | #164 | Good 86.0% |
| Alsatians | 64.3 /100 | #165 | Good 86.0% |
| Immigrants | Albania | 64.2 /100 | #166 | Good 86.0% |
| Ethiopians | 63.7 /100 | #167 | Good 86.0% |
| Sierra Leoneans | 61.8 /100 | #168 | Good 86.0% |
| Immigrants | Ethiopia | 61.2 /100 | #169 | Good 86.0% |
| Afghans | 59.7 /100 | #170 | Average 85.9% |
| Immigrants | Chile | 57.3 /100 | #171 | Average 85.9% |
| Bermudans | 55.1 /100 | #172 | Average 85.8% |
| Immigrants | Venezuela | 50.7 /100 | #173 | Average 85.8% |
| Ottawa | 50.0 /100 | #174 | Average 85.8% |
| Immigrants | Bolivia | 49.8 /100 | #175 | Average 85.8% |
| Immigrants | Eastern Africa | 47.7 /100 | #176 | Average 85.7% |
| Immigrants | Uganda | 45.2 /100 | #177 | Average 85.7% |
| Koreans | 41.2 /100 | #178 | Average 85.6% |