Immigrants from Northern Africa vs Apache Vision Disability
COMPARE
Immigrants from Northern Africa
Apache
Vision Disability
Vision Disability Comparison
Immigrants from Northern Africa
Apache
2.0%
VISION DISABILITY
98.8/ 100
METRIC RATING
67th/ 347
METRIC RANK
3.0%
VISION DISABILITY
0.0/ 100
METRIC RATING
329th/ 347
METRIC RANK
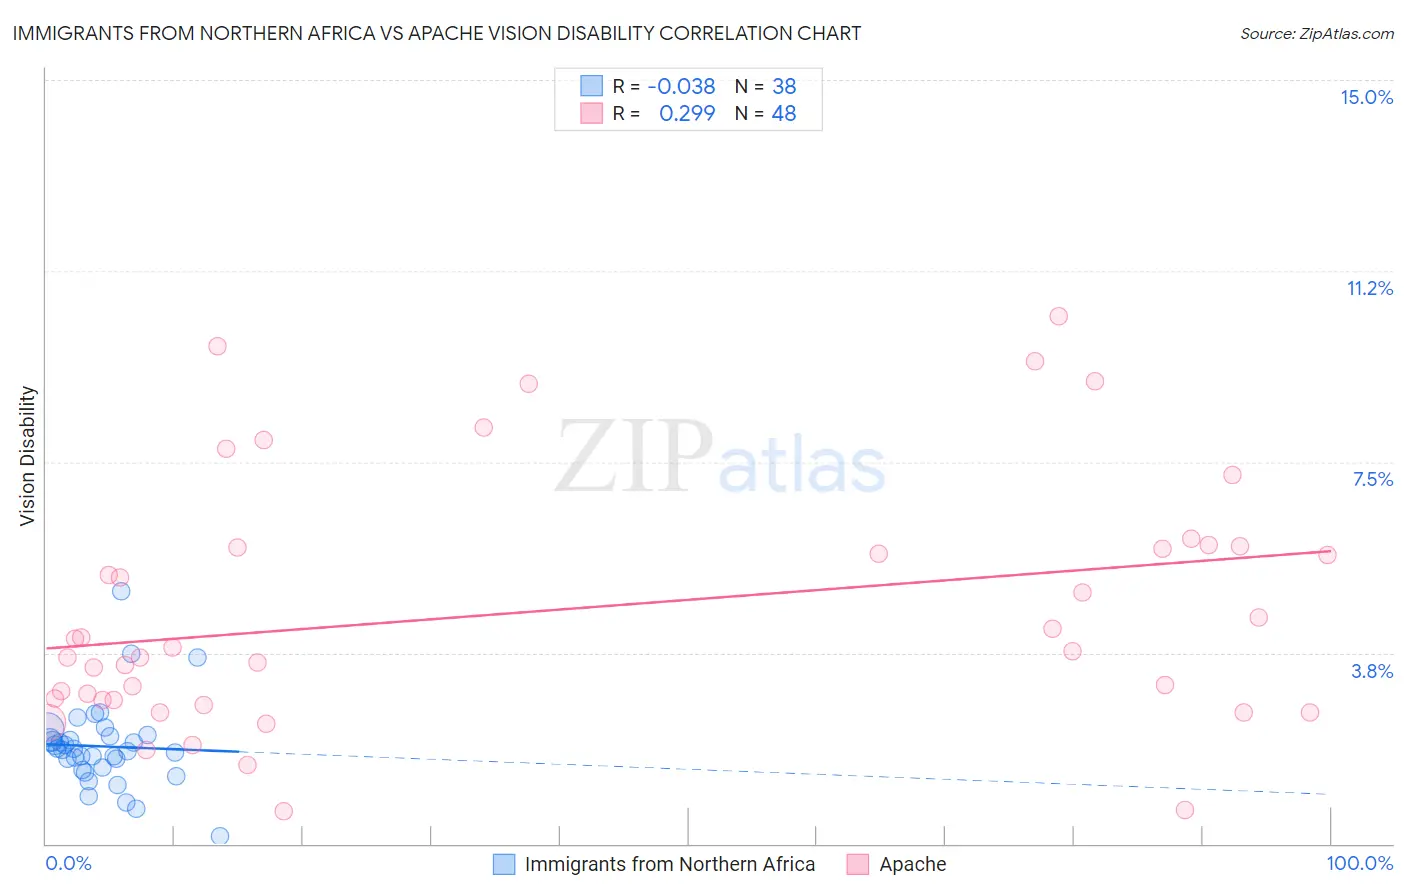
Immigrants from Northern Africa vs Apache Vision Disability Correlation Chart
The statistical analysis conducted on geographies consisting of 321,057,261 people shows no correlation between the proportion of Immigrants from Northern Africa and percentage of population with vision disability in the United States with a correlation coefficient (R) of -0.038 and weighted average of 2.0%. Similarly, the statistical analysis conducted on geographies consisting of 231,003,425 people shows a weak positive correlation between the proportion of Apache and percentage of population with vision disability in the United States with a correlation coefficient (R) of 0.299 and weighted average of 3.0%, a difference of 48.4%.
Vision Disability Correlation Summary
| Measurement | Immigrants from Northern Africa | Apache |
| Minimum | 0.14% | 0.65% |
| Maximum | 5.0% | 10.4% |
| Range | 4.8% | 9.7% |
| Mean | 1.9% | 4.6% |
| Median | 1.9% | 3.8% |
| Interquartile 25% (IQ1) | 1.5% | 2.8% |
| Interquartile 75% (IQ3) | 2.1% | 5.8% |
| Interquartile Range (IQR) | 0.61% | 3.0% |
| Standard Deviation (Sample) | 0.84% | 2.5% |
| Standard Deviation (Population) | 0.83% | 2.4% |
Similar Demographics by Vision Disability
Demographics Similar to Immigrants from Northern Africa by Vision Disability
In terms of vision disability, the demographic groups most similar to Immigrants from Northern Africa are Immigrants from Czechoslovakia (2.0%, a difference of 0.10%), Immigrants from Argentina (2.0%, a difference of 0.11%), Maltese (2.0%, a difference of 0.17%), Immigrants from Greece (2.0%, a difference of 0.24%), and Russian (2.0%, a difference of 0.27%).
| Demographics | Rating | Rank | Vision Disability |
| Immigrants | Romania | 99.1 /100 | #60 | Exceptional 2.0% |
| Immigrants | Belgium | 99.1 /100 | #61 | Exceptional 2.0% |
| Immigrants | Russia | 99.1 /100 | #62 | Exceptional 2.0% |
| Armenians | 99.0 /100 | #63 | Exceptional 2.0% |
| Immigrants | Greece | 99.0 /100 | #64 | Exceptional 2.0% |
| Maltese | 98.9 /100 | #65 | Exceptional 2.0% |
| Immigrants | Argentina | 98.9 /100 | #66 | Exceptional 2.0% |
| Immigrants | Northern Africa | 98.8 /100 | #67 | Exceptional 2.0% |
| Immigrants | Czechoslovakia | 98.7 /100 | #68 | Exceptional 2.0% |
| Russians | 98.6 /100 | #69 | Exceptional 2.0% |
| Immigrants | Kazakhstan | 98.6 /100 | #70 | Exceptional 2.0% |
| Immigrants | Northern Europe | 98.6 /100 | #71 | Exceptional 2.0% |
| Immigrants | France | 98.5 /100 | #72 | Exceptional 2.0% |
| Immigrants | Eritrea | 98.4 /100 | #73 | Exceptional 2.0% |
| Palestinians | 98.3 /100 | #74 | Exceptional 2.0% |
Demographics Similar to Apache by Vision Disability
In terms of vision disability, the demographic groups most similar to Apache are Yuman (3.0%, a difference of 0.19%), Native/Alaskan (3.0%, a difference of 0.74%), Colville (3.0%, a difference of 1.2%), Spanish American (2.9%, a difference of 1.5%), and Central American Indian (3.0%, a difference of 1.8%).
| Demographics | Rating | Rank | Vision Disability |
| Paiute | 0.0 /100 | #322 | Tragic 2.9% |
| Tlingit-Haida | 0.0 /100 | #323 | Tragic 2.9% |
| Hopi | 0.0 /100 | #324 | Tragic 2.9% |
| Cherokee | 0.0 /100 | #325 | Tragic 2.9% |
| Spanish Americans | 0.0 /100 | #326 | Tragic 2.9% |
| Natives/Alaskans | 0.0 /100 | #327 | Tragic 3.0% |
| Yuman | 0.0 /100 | #328 | Tragic 3.0% |
| Apache | 0.0 /100 | #329 | Tragic 3.0% |
| Colville | 0.0 /100 | #330 | Tragic 3.0% |
| Central American Indians | 0.0 /100 | #331 | Tragic 3.0% |
| Seminole | 0.0 /100 | #332 | Tragic 3.1% |
| Cajuns | 0.0 /100 | #333 | Tragic 3.1% |
| Cheyenne | 0.0 /100 | #334 | Tragic 3.1% |
| Navajo | 0.0 /100 | #335 | Tragic 3.1% |
| Alaskan Athabascans | 0.0 /100 | #336 | Tragic 3.1% |