Black/African American vs Apache College, Under 1 year
COMPARE
Black/African American
Apache
College, Under 1 year
College, Under 1 year Comparison
Blacks/African Americans
Apache
59.4%
COLLEGE, UNDER 1 YEAR
0.0/ 100
METRIC RATING
288th/ 347
METRIC RANK
58.0%
COLLEGE, UNDER 1 YEAR
0.0/ 100
METRIC RATING
302nd/ 347
METRIC RANK
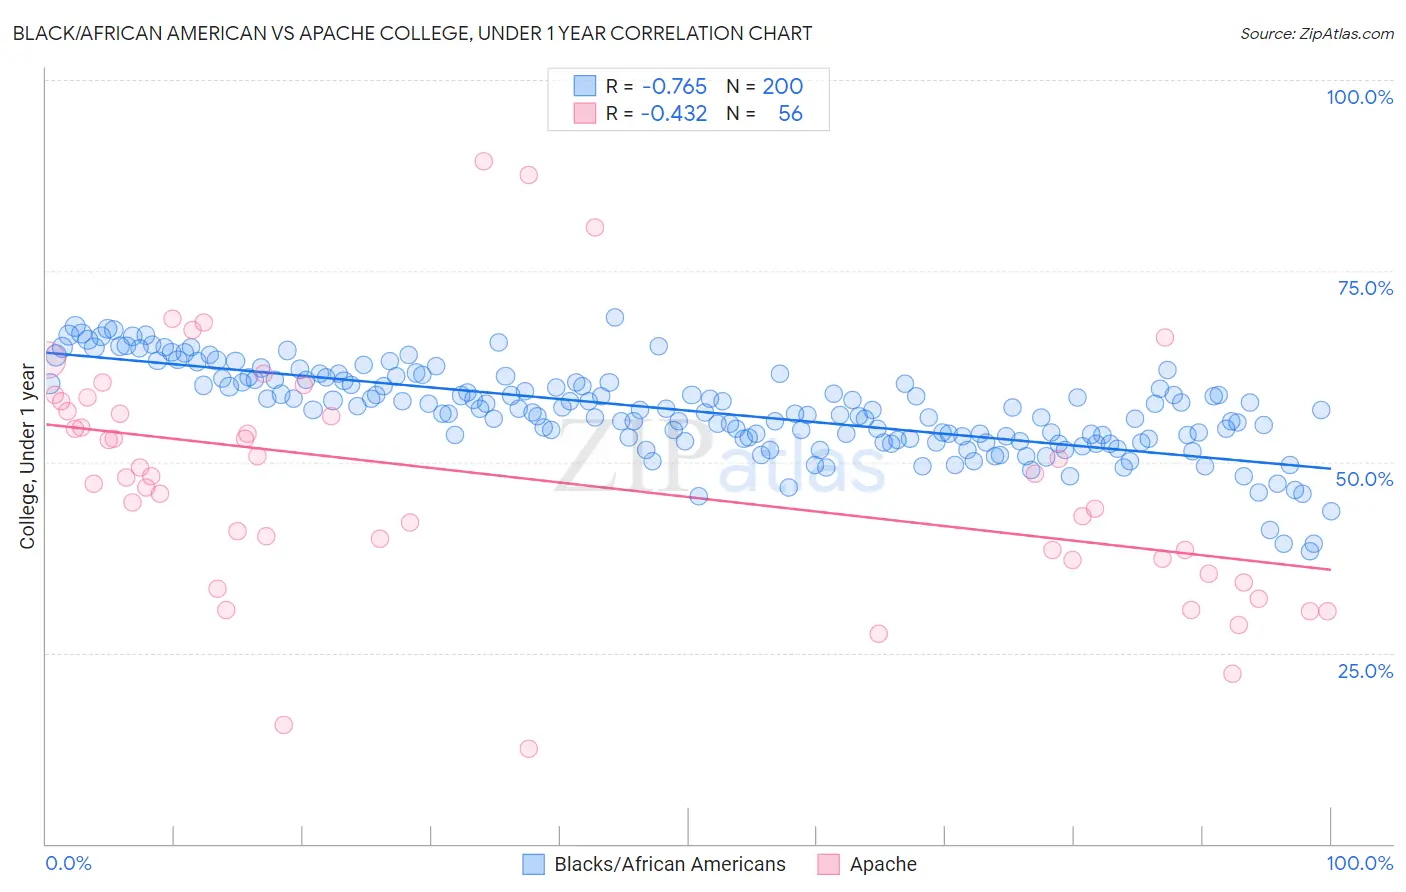
Black/African American vs Apache College, Under 1 year Correlation Chart
The statistical analysis conducted on geographies consisting of 566,038,640 people shows a strong negative correlation between the proportion of Blacks/African Americans and percentage of population with at least college, under 1 year education in the United States with a correlation coefficient (R) of -0.765 and weighted average of 59.4%. Similarly, the statistical analysis conducted on geographies consisting of 231,142,948 people shows a moderate negative correlation between the proportion of Apache and percentage of population with at least college, under 1 year education in the United States with a correlation coefficient (R) of -0.432 and weighted average of 58.0%, a difference of 2.4%.
College, Under 1 year Correlation Summary
| Measurement | Black/African American | Apache |
| Minimum | 38.4% | 12.5% |
| Maximum | 68.9% | 89.3% |
| Range | 30.5% | 76.8% |
| Mean | 56.7% | 47.9% |
| Median | 56.8% | 48.0% |
| Interquartile 25% (IQ1) | 53.0% | 37.3% |
| Interquartile 75% (IQ3) | 60.7% | 57.3% |
| Interquartile Range (IQR) | 7.6% | 20.1% |
| Standard Deviation (Sample) | 5.8% | 15.9% |
| Standard Deviation (Population) | 5.7% | 15.7% |
Demographics Similar to Blacks/African Americans and Apache by College, Under 1 year
In terms of college, under 1 year, the demographic groups most similar to Blacks/African Americans are Choctaw (59.3%, a difference of 0.070%), Sioux (59.4%, a difference of 0.10%), Ecuadorian (59.3%, a difference of 0.11%), Creek (59.3%, a difference of 0.20%), and Nicaraguan (59.2%, a difference of 0.24%). Similarly, the demographic groups most similar to Apache are Mexican American Indian (58.1%, a difference of 0.19%), Immigrants from Dominica (57.9%, a difference of 0.29%), Kiowa (57.8%, a difference of 0.30%), Haitian (57.8%, a difference of 0.42%), and Immigrants from Guyana (58.5%, a difference of 0.81%).
| Demographics | Rating | Rank | College, Under 1 year |
| Paiute | 0.0 /100 | #285 | Tragic 59.6% |
| British West Indians | 0.0 /100 | #286 | Tragic 59.5% |
| Sioux | 0.0 /100 | #287 | Tragic 59.4% |
| Blacks/African Americans | 0.0 /100 | #288 | Tragic 59.4% |
| Choctaw | 0.0 /100 | #289 | Tragic 59.3% |
| Ecuadorians | 0.0 /100 | #290 | Tragic 59.3% |
| Creek | 0.0 /100 | #291 | Tragic 59.3% |
| Nicaraguans | 0.0 /100 | #292 | Tragic 59.2% |
| Seminole | 0.0 /100 | #293 | Tragic 59.1% |
| Immigrants | Belize | 0.0 /100 | #294 | Tragic 59.1% |
| Immigrants | Grenada | 0.0 /100 | #295 | Tragic 59.1% |
| Central American Indians | 0.0 /100 | #296 | Tragic 59.0% |
| Guyanese | 0.0 /100 | #297 | Tragic 59.0% |
| Immigrants | Ecuador | 0.0 /100 | #298 | Tragic 58.7% |
| Cubans | 0.0 /100 | #299 | Tragic 58.6% |
| Immigrants | Guyana | 0.0 /100 | #300 | Tragic 58.5% |
| Mexican American Indians | 0.0 /100 | #301 | Tragic 58.1% |
| Apache | 0.0 /100 | #302 | Tragic 58.0% |
| Immigrants | Dominica | 0.0 /100 | #303 | Tragic 57.9% |
| Kiowa | 0.0 /100 | #304 | Tragic 57.8% |
| Haitians | 0.0 /100 | #305 | Tragic 57.8% |