Immigrants from Nepal vs Immigrants from Hungary Single Mother Households
COMPARE
Immigrants from Nepal
Immigrants from Hungary
Single Mother Households
Single Mother Households Comparison
Immigrants from Nepal
Immigrants from Hungary
6.4%
SINGLE MOTHER HOUSEHOLDS
36.1/ 100
METRIC RATING
180th/ 347
METRIC RANK
5.7%
SINGLE MOTHER HOUSEHOLDS
97.8/ 100
METRIC RATING
83rd/ 347
METRIC RANK
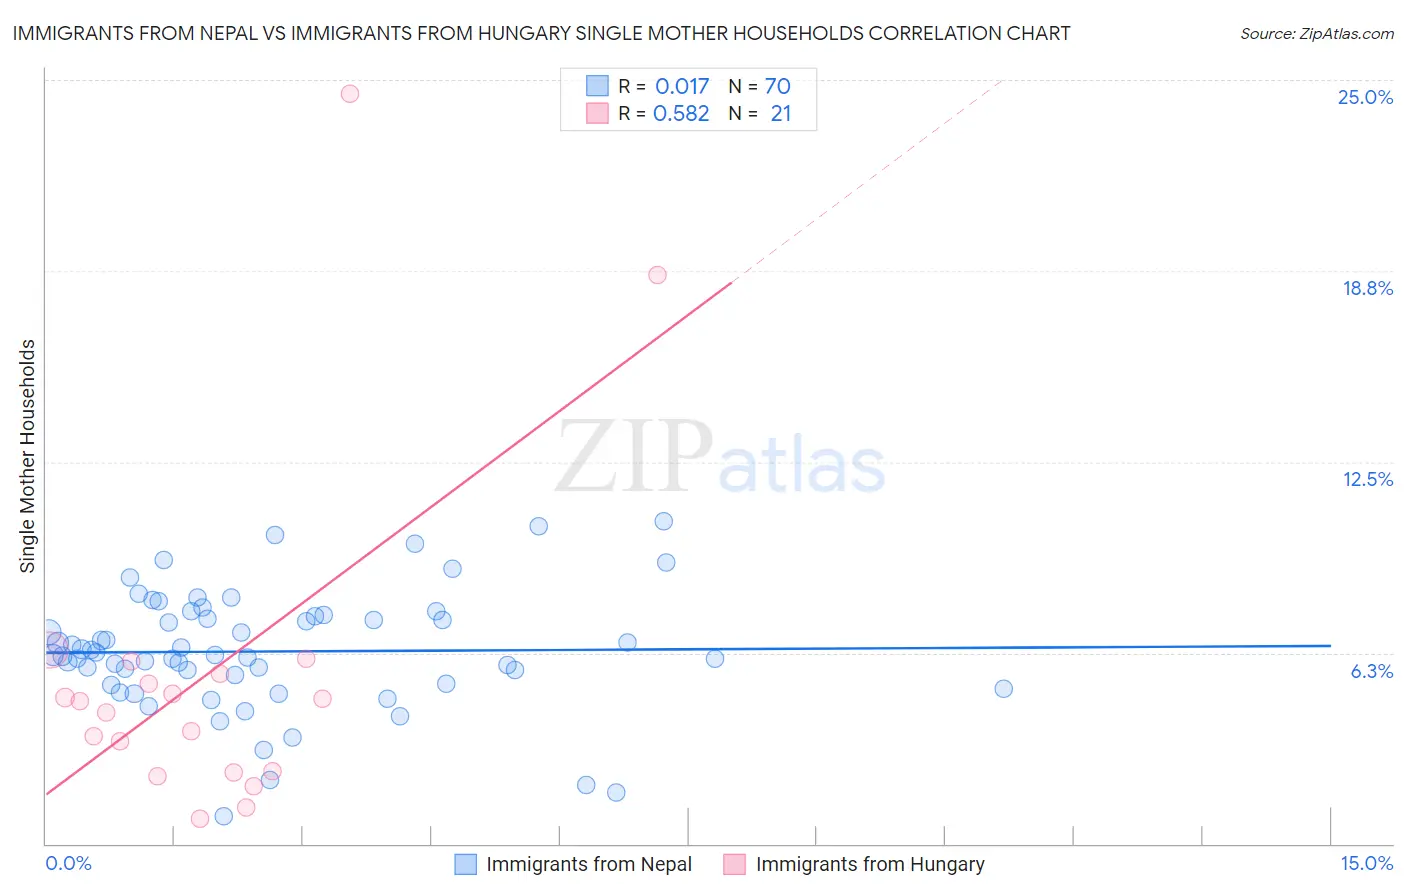
Immigrants from Nepal vs Immigrants from Hungary Single Mother Households Correlation Chart
The statistical analysis conducted on geographies consisting of 186,604,870 people shows no correlation between the proportion of Immigrants from Nepal and percentage of single mother households in the United States with a correlation coefficient (R) of 0.017 and weighted average of 6.4%. Similarly, the statistical analysis conducted on geographies consisting of 195,293,464 people shows a substantial positive correlation between the proportion of Immigrants from Hungary and percentage of single mother households in the United States with a correlation coefficient (R) of 0.582 and weighted average of 5.7%, a difference of 13.3%.
Single Mother Households Correlation Summary
| Measurement | Immigrants from Nepal | Immigrants from Hungary |
| Minimum | 0.90% | 0.83% |
| Maximum | 10.6% | 24.6% |
| Range | 9.7% | 23.7% |
| Mean | 6.3% | 5.6% |
| Median | 6.2% | 4.7% |
| Interquartile 25% (IQ1) | 5.2% | 2.4% |
| Interquartile 75% (IQ3) | 7.5% | 5.8% |
| Interquartile Range (IQR) | 2.2% | 3.4% |
| Standard Deviation (Sample) | 1.9% | 5.6% |
| Standard Deviation (Population) | 1.9% | 5.5% |
Similar Demographics by Single Mother Households
Demographics Similar to Immigrants from Nepal by Single Mother Households
In terms of single mother households, the demographic groups most similar to Immigrants from Nepal are Spanish (6.4%, a difference of 0.32%), South American Indian (6.4%, a difference of 0.32%), Hmong (6.4%, a difference of 0.43%), Portuguese (6.4%, a difference of 0.45%), and Osage (6.4%, a difference of 0.79%).
| Demographics | Rating | Rank | Single Mother Households |
| Immigrants | Vietnam | 51.5 /100 | #173 | Average 6.3% |
| Immigrants | Morocco | 50.0 /100 | #174 | Average 6.3% |
| Marshallese | 45.8 /100 | #175 | Average 6.3% |
| Immigrants | Bosnia and Herzegovina | 44.3 /100 | #176 | Average 6.3% |
| Osage | 43.0 /100 | #177 | Average 6.4% |
| Portuguese | 40.0 /100 | #178 | Fair 6.4% |
| Hmong | 39.8 /100 | #179 | Fair 6.4% |
| Immigrants | Nepal | 36.1 /100 | #180 | Fair 6.4% |
| Spanish | 33.4 /100 | #181 | Fair 6.4% |
| South American Indians | 33.4 /100 | #182 | Fair 6.4% |
| Spaniards | 27.8 /100 | #183 | Fair 6.5% |
| Ethiopians | 26.0 /100 | #184 | Fair 6.5% |
| Ugandans | 25.6 /100 | #185 | Fair 6.5% |
| Costa Ricans | 24.8 /100 | #186 | Fair 6.5% |
| Immigrants | Afghanistan | 24.7 /100 | #187 | Fair 6.5% |
Demographics Similar to Immigrants from Hungary by Single Mother Households
In terms of single mother households, the demographic groups most similar to Immigrants from Hungary are Immigrants from Malaysia (5.7%, a difference of 0.030%), Carpatho Rusyn (5.7%, a difference of 0.080%), Hungarian (5.7%, a difference of 0.23%), Czech (5.6%, a difference of 0.24%), and Immigrants from Moldova (5.6%, a difference of 0.24%).
| Demographics | Rating | Rank | Single Mother Households |
| New Zealanders | 98.2 /100 | #76 | Exceptional 5.6% |
| Romanians | 98.1 /100 | #77 | Exceptional 5.6% |
| Swiss | 98.1 /100 | #78 | Exceptional 5.6% |
| Immigrants | Sri Lanka | 98.0 /100 | #79 | Exceptional 5.6% |
| Czechs | 97.9 /100 | #80 | Exceptional 5.6% |
| Immigrants | Moldova | 97.9 /100 | #81 | Exceptional 5.6% |
| Immigrants | Malaysia | 97.8 /100 | #82 | Exceptional 5.7% |
| Immigrants | Hungary | 97.8 /100 | #83 | Exceptional 5.7% |
| Carpatho Rusyns | 97.7 /100 | #84 | Exceptional 5.7% |
| Hungarians | 97.6 /100 | #85 | Exceptional 5.7% |
| Finns | 97.6 /100 | #86 | Exceptional 5.7% |
| Immigrants | Turkey | 97.5 /100 | #87 | Exceptional 5.7% |
| Israelis | 97.4 /100 | #88 | Exceptional 5.7% |
| Ukrainians | 97.2 /100 | #89 | Exceptional 5.7% |
| Immigrants | Indonesia | 97.2 /100 | #90 | Exceptional 5.7% |