Immigrants from Morocco vs Immigrants from Somalia College, 1 year or more
COMPARE
Immigrants from Morocco
Immigrants from Somalia
College, 1 year or more
College, 1 year or more Comparison
Immigrants from Morocco
Immigrants from Somalia
61.1%
COLLEGE, 1 YEAR OR MORE
89.5/ 100
METRIC RATING
131st/ 347
METRIC RANK
59.7%
COLLEGE, 1 YEAR OR MORE
58.3/ 100
METRIC RATING
163rd/ 347
METRIC RANK
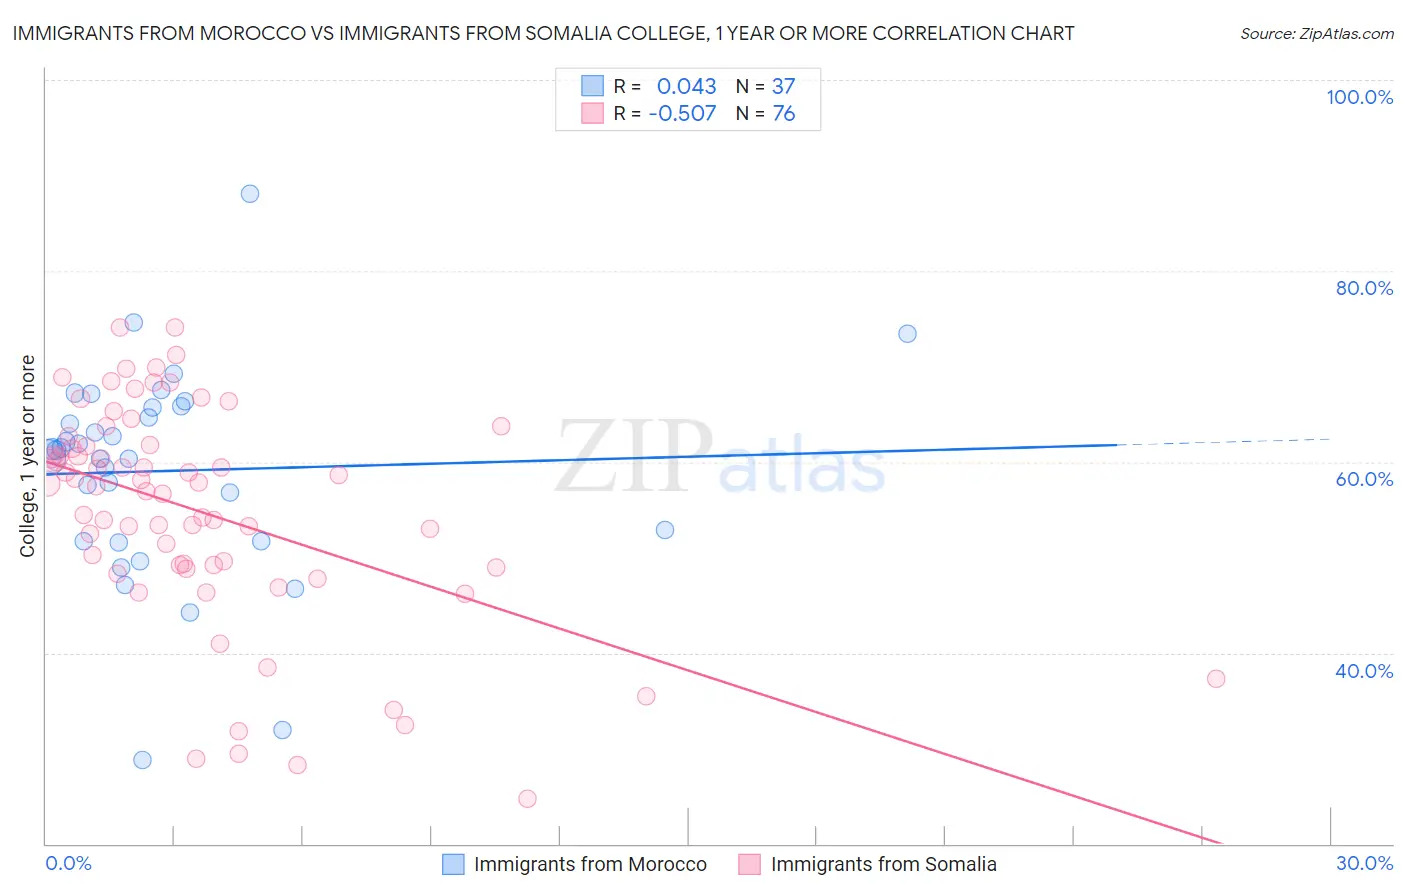
Immigrants from Morocco vs Immigrants from Somalia College, 1 year or more Correlation Chart
The statistical analysis conducted on geographies consisting of 178,912,438 people shows no correlation between the proportion of Immigrants from Morocco and percentage of population with at least college, 1 year or more education in the United States with a correlation coefficient (R) of 0.043 and weighted average of 61.1%. Similarly, the statistical analysis conducted on geographies consisting of 92,111,755 people shows a substantial negative correlation between the proportion of Immigrants from Somalia and percentage of population with at least college, 1 year or more education in the United States with a correlation coefficient (R) of -0.507 and weighted average of 59.7%, a difference of 2.4%.
College, 1 year or more Correlation Summary
| Measurement | Immigrants from Morocco | Immigrants from Somalia |
| Minimum | 28.8% | 24.7% |
| Maximum | 88.0% | 74.1% |
| Range | 59.2% | 49.4% |
| Mean | 59.1% | 54.7% |
| Median | 61.2% | 57.6% |
| Interquartile 25% (IQ1) | 51.7% | 49.0% |
| Interquartile 75% (IQ3) | 65.7% | 61.7% |
| Interquartile Range (IQR) | 14.0% | 12.7% |
| Standard Deviation (Sample) | 11.1% | 11.5% |
| Standard Deviation (Population) | 10.9% | 11.4% |
Similar Demographics by College, 1 year or more
Demographics Similar to Immigrants from Morocco by College, 1 year or more
In terms of college, 1 year or more, the demographic groups most similar to Immigrants from Morocco are Italian (61.1%, a difference of 0.0%), Scandinavian (61.0%, a difference of 0.16%), Ugandan (61.2%, a difference of 0.18%), Immigrants from Uzbekistan (61.0%, a difference of 0.19%), and Immigrants from Venezuela (61.0%, a difference of 0.21%).
| Demographics | Rating | Rank | College, 1 year or more |
| Venezuelans | 92.1 /100 | #124 | Exceptional 61.3% |
| Immigrants | Syria | 91.6 /100 | #125 | Exceptional 61.3% |
| Alsatians | 91.3 /100 | #126 | Exceptional 61.3% |
| Immigrants | Eastern Africa | 91.1 /100 | #127 | Exceptional 61.2% |
| Immigrants | Italy | 91.1 /100 | #128 | Exceptional 61.2% |
| Ugandans | 90.7 /100 | #129 | Exceptional 61.2% |
| Italians | 89.5 /100 | #130 | Excellent 61.1% |
| Immigrants | Morocco | 89.5 /100 | #131 | Excellent 61.1% |
| Scandinavians | 88.2 /100 | #132 | Excellent 61.0% |
| Immigrants | Uzbekistan | 88.0 /100 | #133 | Excellent 61.0% |
| Immigrants | Venezuela | 87.9 /100 | #134 | Excellent 61.0% |
| Immigrants | Uganda | 87.4 /100 | #135 | Excellent 60.9% |
| Basques | 87.2 /100 | #136 | Excellent 60.9% |
| Slovenes | 86.5 /100 | #137 | Excellent 60.9% |
| Taiwanese | 84.3 /100 | #138 | Excellent 60.7% |
Demographics Similar to Immigrants from Somalia by College, 1 year or more
In terms of college, 1 year or more, the demographic groups most similar to Immigrants from Somalia are Korean (59.7%, a difference of 0.010%), Belgian (59.7%, a difference of 0.010%), Irish (59.6%, a difference of 0.12%), Immigrants from Africa (59.6%, a difference of 0.12%), and Immigrants from North Macedonia (59.5%, a difference of 0.28%).
| Demographics | Rating | Rank | College, 1 year or more |
| Finns | 72.9 /100 | #156 | Good 60.2% |
| Immigrants | Armenia | 68.8 /100 | #157 | Good 60.0% |
| English | 67.2 /100 | #158 | Good 60.0% |
| Immigrants | Iraq | 67.0 /100 | #159 | Good 60.0% |
| South American Indians | 66.9 /100 | #160 | Good 60.0% |
| Somalis | 64.5 /100 | #161 | Good 59.9% |
| Koreans | 58.5 /100 | #162 | Average 59.7% |
| Immigrants | Somalia | 58.3 /100 | #163 | Average 59.7% |
| Belgians | 58.1 /100 | #164 | Average 59.7% |
| Irish | 56.1 /100 | #165 | Average 59.6% |
| Immigrants | Africa | 56.1 /100 | #166 | Average 59.6% |
| Immigrants | North Macedonia | 53.1 /100 | #167 | Average 59.5% |
| Hungarians | 52.9 /100 | #168 | Average 59.5% |
| Immigrants | Southern Europe | 52.7 /100 | #169 | Average 59.5% |
| Welsh | 52.4 /100 | #170 | Average 59.5% |