Immigrants from Morocco vs Immigrants from Bangladesh College, 1 year or more
COMPARE
Immigrants from Morocco
Immigrants from Bangladesh
College, 1 year or more
College, 1 year or more Comparison
Immigrants from Morocco
Immigrants from Bangladesh
61.1%
COLLEGE, 1 YEAR OR MORE
89.5/ 100
METRIC RATING
131st/ 347
METRIC RANK
56.6%
COLLEGE, 1 YEAR OR MORE
2.6/ 100
METRIC RATING
232nd/ 347
METRIC RANK
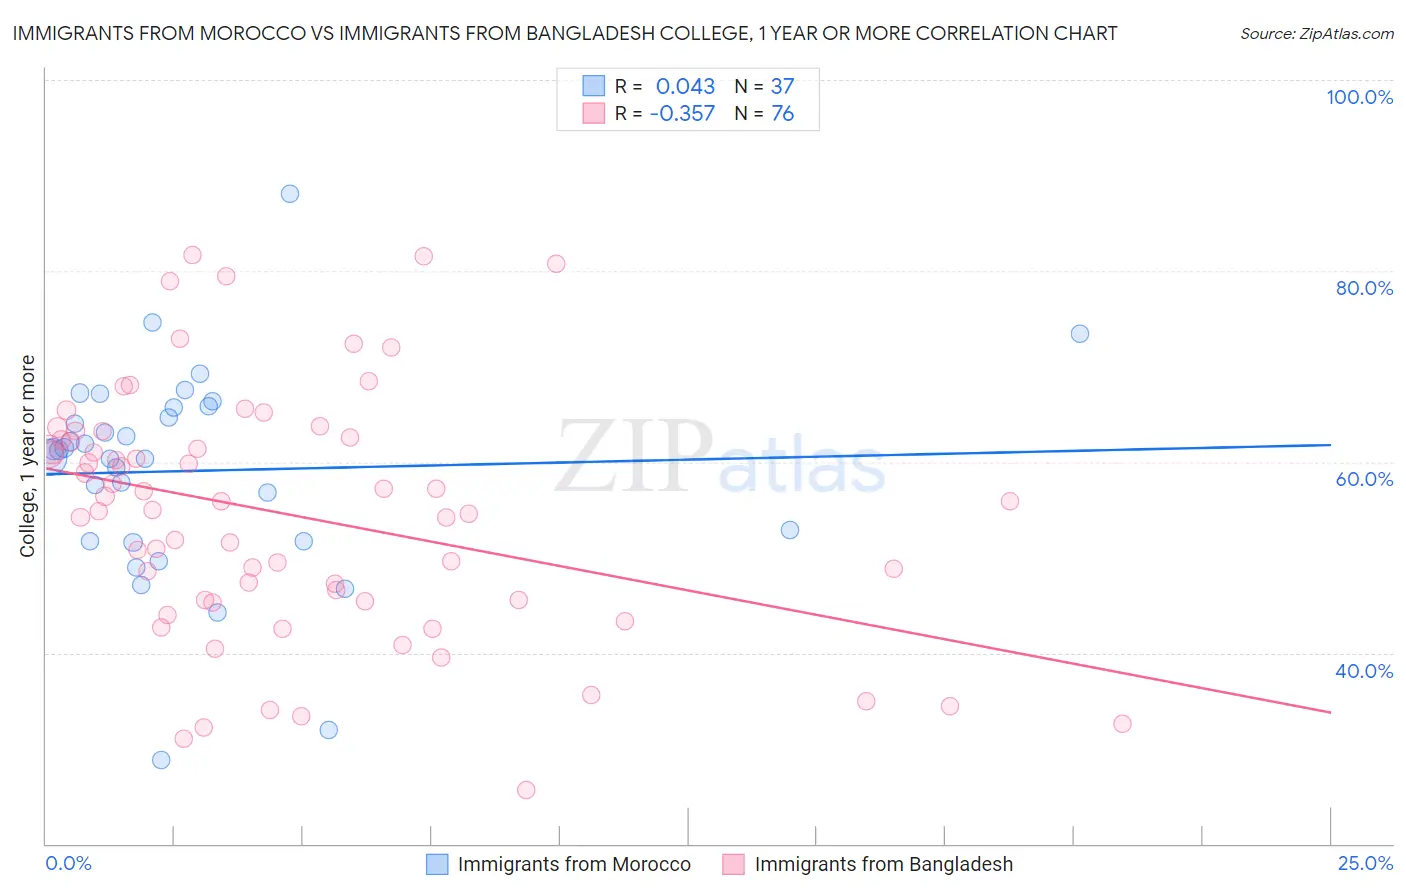
Immigrants from Morocco vs Immigrants from Bangladesh College, 1 year or more Correlation Chart
The statistical analysis conducted on geographies consisting of 178,912,438 people shows no correlation between the proportion of Immigrants from Morocco and percentage of population with at least college, 1 year or more education in the United States with a correlation coefficient (R) of 0.043 and weighted average of 61.1%. Similarly, the statistical analysis conducted on geographies consisting of 203,680,191 people shows a mild negative correlation between the proportion of Immigrants from Bangladesh and percentage of population with at least college, 1 year or more education in the United States with a correlation coefficient (R) of -0.357 and weighted average of 56.6%, a difference of 8.0%.
College, 1 year or more Correlation Summary
| Measurement | Immigrants from Morocco | Immigrants from Bangladesh |
| Minimum | 28.8% | 25.6% |
| Maximum | 88.0% | 81.7% |
| Range | 59.2% | 56.1% |
| Mean | 59.1% | 54.4% |
| Median | 61.2% | 55.4% |
| Interquartile 25% (IQ1) | 51.7% | 45.5% |
| Interquartile 75% (IQ3) | 65.7% | 62.4% |
| Interquartile Range (IQR) | 14.0% | 16.9% |
| Standard Deviation (Sample) | 11.1% | 12.9% |
| Standard Deviation (Population) | 10.9% | 12.8% |
Similar Demographics by College, 1 year or more
Demographics Similar to Immigrants from Morocco by College, 1 year or more
In terms of college, 1 year or more, the demographic groups most similar to Immigrants from Morocco are Italian (61.1%, a difference of 0.0%), Scandinavian (61.0%, a difference of 0.16%), Ugandan (61.2%, a difference of 0.18%), Immigrants from Uzbekistan (61.0%, a difference of 0.19%), and Immigrants from Venezuela (61.0%, a difference of 0.21%).
| Demographics | Rating | Rank | College, 1 year or more |
| Venezuelans | 92.1 /100 | #124 | Exceptional 61.3% |
| Immigrants | Syria | 91.6 /100 | #125 | Exceptional 61.3% |
| Alsatians | 91.3 /100 | #126 | Exceptional 61.3% |
| Immigrants | Eastern Africa | 91.1 /100 | #127 | Exceptional 61.2% |
| Immigrants | Italy | 91.1 /100 | #128 | Exceptional 61.2% |
| Ugandans | 90.7 /100 | #129 | Exceptional 61.2% |
| Italians | 89.5 /100 | #130 | Excellent 61.1% |
| Immigrants | Morocco | 89.5 /100 | #131 | Excellent 61.1% |
| Scandinavians | 88.2 /100 | #132 | Excellent 61.0% |
| Immigrants | Uzbekistan | 88.0 /100 | #133 | Excellent 61.0% |
| Immigrants | Venezuela | 87.9 /100 | #134 | Excellent 61.0% |
| Immigrants | Uganda | 87.4 /100 | #135 | Excellent 60.9% |
| Basques | 87.2 /100 | #136 | Excellent 60.9% |
| Slovenes | 86.5 /100 | #137 | Excellent 60.9% |
| Taiwanese | 84.3 /100 | #138 | Excellent 60.7% |
Demographics Similar to Immigrants from Bangladesh by College, 1 year or more
In terms of college, 1 year or more, the demographic groups most similar to Immigrants from Bangladesh are Immigrants from Burma/Myanmar (56.6%, a difference of 0.060%), Nonimmigrants (56.5%, a difference of 0.090%), Liberian (56.7%, a difference of 0.25%), Cree (56.8%, a difference of 0.47%), and Spanish American (56.3%, a difference of 0.54%).
| Demographics | Rating | Rank | College, 1 year or more |
| Vietnamese | 4.7 /100 | #225 | Tragic 57.0% |
| Immigrants | Western Africa | 4.6 /100 | #226 | Tragic 57.0% |
| Immigrants | Immigrants | 4.4 /100 | #227 | Tragic 57.0% |
| Immigrants | Fiji | 4.0 /100 | #228 | Tragic 56.9% |
| Cree | 3.6 /100 | #229 | Tragic 56.8% |
| Liberians | 3.1 /100 | #230 | Tragic 56.7% |
| Immigrants | Burma/Myanmar | 2.7 /100 | #231 | Tragic 56.6% |
| Immigrants | Bangladesh | 2.6 /100 | #232 | Tragic 56.6% |
| Immigrants | Nonimmigrants | 2.5 /100 | #233 | Tragic 56.5% |
| Spanish Americans | 1.8 /100 | #234 | Tragic 56.3% |
| West Indians | 1.8 /100 | #235 | Tragic 56.3% |
| Iroquois | 1.7 /100 | #236 | Tragic 56.2% |
| Samoans | 1.6 /100 | #237 | Tragic 56.2% |
| Barbadians | 1.3 /100 | #238 | Tragic 56.0% |
| Puget Sound Salish | 1.1 /100 | #239 | Tragic 55.9% |