Immigrants from Morocco vs Yugoslavian College, 1 year or more
COMPARE
Immigrants from Morocco
Yugoslavian
College, 1 year or more
College, 1 year or more Comparison
Immigrants from Morocco
Yugoslavians
61.1%
COLLEGE, 1 YEAR OR MORE
89.5/ 100
METRIC RATING
131st/ 347
METRIC RANK
59.2%
COLLEGE, 1 YEAR OR MORE
44.1/ 100
METRIC RATING
180th/ 347
METRIC RANK
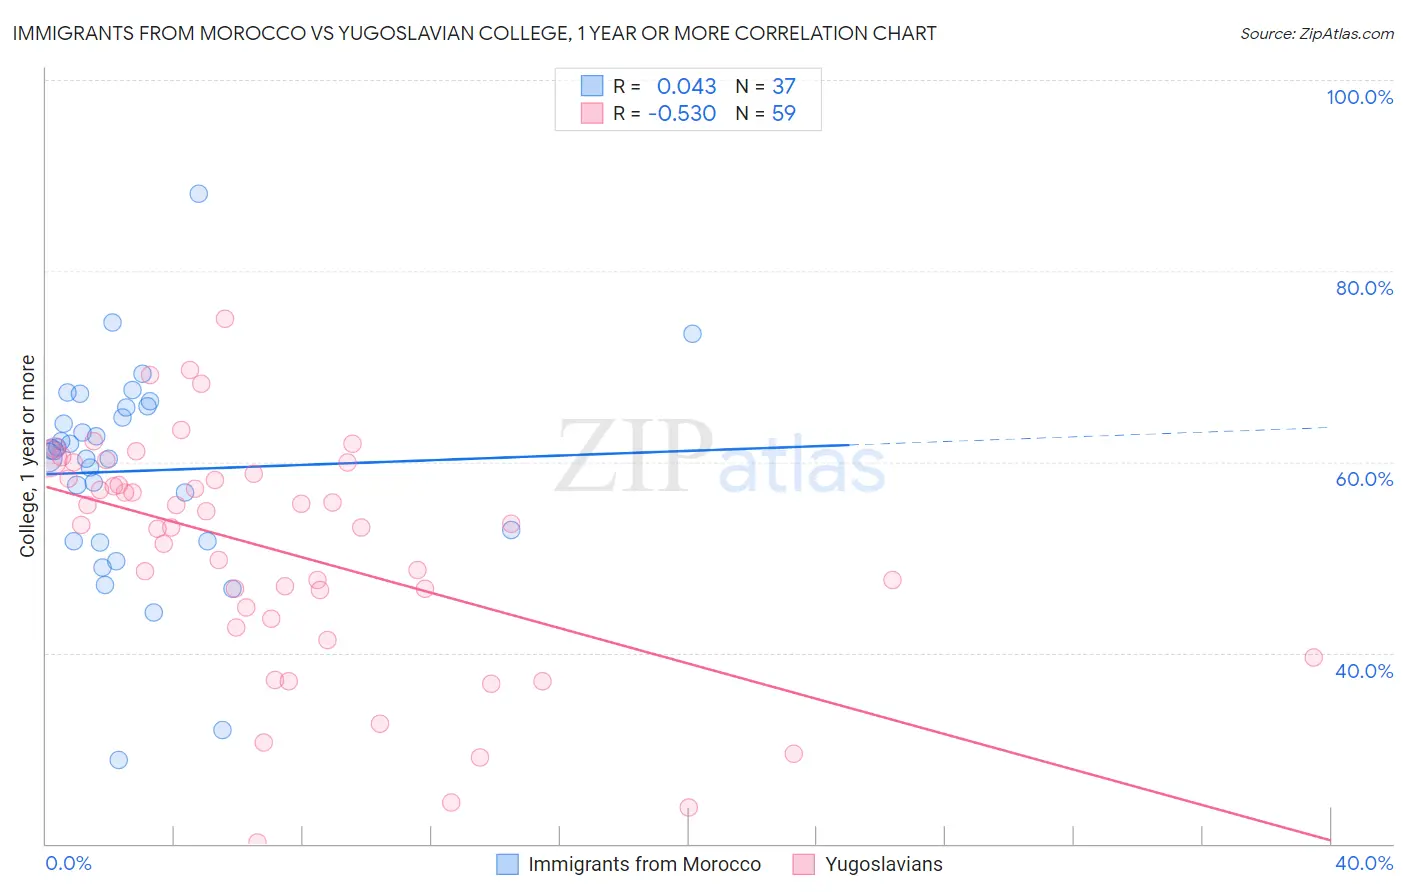
Immigrants from Morocco vs Yugoslavian College, 1 year or more Correlation Chart
The statistical analysis conducted on geographies consisting of 178,912,438 people shows no correlation between the proportion of Immigrants from Morocco and percentage of population with at least college, 1 year or more education in the United States with a correlation coefficient (R) of 0.043 and weighted average of 61.1%. Similarly, the statistical analysis conducted on geographies consisting of 285,723,201 people shows a substantial negative correlation between the proportion of Yugoslavians and percentage of population with at least college, 1 year or more education in the United States with a correlation coefficient (R) of -0.530 and weighted average of 59.2%, a difference of 3.2%.
College, 1 year or more Correlation Summary
| Measurement | Immigrants from Morocco | Yugoslavian |
| Minimum | 28.8% | 20.1% |
| Maximum | 88.0% | 75.0% |
| Range | 59.2% | 54.9% |
| Mean | 59.1% | 50.6% |
| Median | 61.2% | 53.3% |
| Interquartile 25% (IQ1) | 51.7% | 43.6% |
| Interquartile 75% (IQ3) | 65.7% | 58.8% |
| Interquartile Range (IQR) | 14.0% | 15.2% |
| Standard Deviation (Sample) | 11.1% | 12.1% |
| Standard Deviation (Population) | 10.9% | 12.0% |
Similar Demographics by College, 1 year or more
Demographics Similar to Immigrants from Morocco by College, 1 year or more
In terms of college, 1 year or more, the demographic groups most similar to Immigrants from Morocco are Italian (61.1%, a difference of 0.0%), Scandinavian (61.0%, a difference of 0.16%), Ugandan (61.2%, a difference of 0.18%), Immigrants from Uzbekistan (61.0%, a difference of 0.19%), and Immigrants from Venezuela (61.0%, a difference of 0.21%).
| Demographics | Rating | Rank | College, 1 year or more |
| Venezuelans | 92.1 /100 | #124 | Exceptional 61.3% |
| Immigrants | Syria | 91.6 /100 | #125 | Exceptional 61.3% |
| Alsatians | 91.3 /100 | #126 | Exceptional 61.3% |
| Immigrants | Eastern Africa | 91.1 /100 | #127 | Exceptional 61.2% |
| Immigrants | Italy | 91.1 /100 | #128 | Exceptional 61.2% |
| Ugandans | 90.7 /100 | #129 | Exceptional 61.2% |
| Italians | 89.5 /100 | #130 | Excellent 61.1% |
| Immigrants | Morocco | 89.5 /100 | #131 | Excellent 61.1% |
| Scandinavians | 88.2 /100 | #132 | Excellent 61.0% |
| Immigrants | Uzbekistan | 88.0 /100 | #133 | Excellent 61.0% |
| Immigrants | Venezuela | 87.9 /100 | #134 | Excellent 61.0% |
| Immigrants | Uganda | 87.4 /100 | #135 | Excellent 60.9% |
| Basques | 87.2 /100 | #136 | Excellent 60.9% |
| Slovenes | 86.5 /100 | #137 | Excellent 60.9% |
| Taiwanese | 84.3 /100 | #138 | Excellent 60.7% |
Demographics Similar to Yugoslavians by College, 1 year or more
In terms of college, 1 year or more, the demographic groups most similar to Yugoslavians are Swiss (59.2%, a difference of 0.040%), Immigrants from Bosnia and Herzegovina (59.2%, a difference of 0.070%), Bermudan (59.3%, a difference of 0.14%), Tlingit-Haida (59.4%, a difference of 0.23%), and Czechoslovakian (59.4%, a difference of 0.23%).
| Demographics | Rating | Rank | College, 1 year or more |
| Immigrants | Oceania | 51.2 /100 | #173 | Average 59.4% |
| Celtics | 50.0 /100 | #174 | Average 59.4% |
| Sri Lankans | 49.0 /100 | #175 | Average 59.4% |
| Immigrants | Poland | 48.9 /100 | #176 | Average 59.4% |
| Tlingit-Haida | 48.4 /100 | #177 | Average 59.4% |
| Czechoslovakians | 48.3 /100 | #178 | Average 59.4% |
| Bermudans | 46.6 /100 | #179 | Average 59.3% |
| Yugoslavians | 44.1 /100 | #180 | Average 59.2% |
| Swiss | 43.4 /100 | #181 | Average 59.2% |
| Immigrants | Bosnia and Herzegovina | 42.8 /100 | #182 | Average 59.2% |
| German Russians | 39.3 /100 | #183 | Fair 59.1% |
| Spaniards | 38.3 /100 | #184 | Fair 59.0% |
| South Americans | 35.9 /100 | #185 | Fair 59.0% |
| Scotch-Irish | 34.7 /100 | #186 | Fair 58.9% |
| Germans | 34.7 /100 | #187 | Fair 58.9% |