Immigrants from Morocco vs Immigrants from Somalia In Labor Force | Age 20-24
COMPARE
Immigrants from Morocco
Immigrants from Somalia
In Labor Force | Age 20-24
In Labor Force | Age 20-24 Comparison
Immigrants from Morocco
Immigrants from Somalia
75.9%
IN LABOR FORCE | AGE 20-24
95.8/ 100
METRIC RATING
110th/ 347
METRIC RANK
79.5%
IN LABOR FORCE | AGE 20-24
100.0/ 100
METRIC RATING
2nd/ 347
METRIC RANK
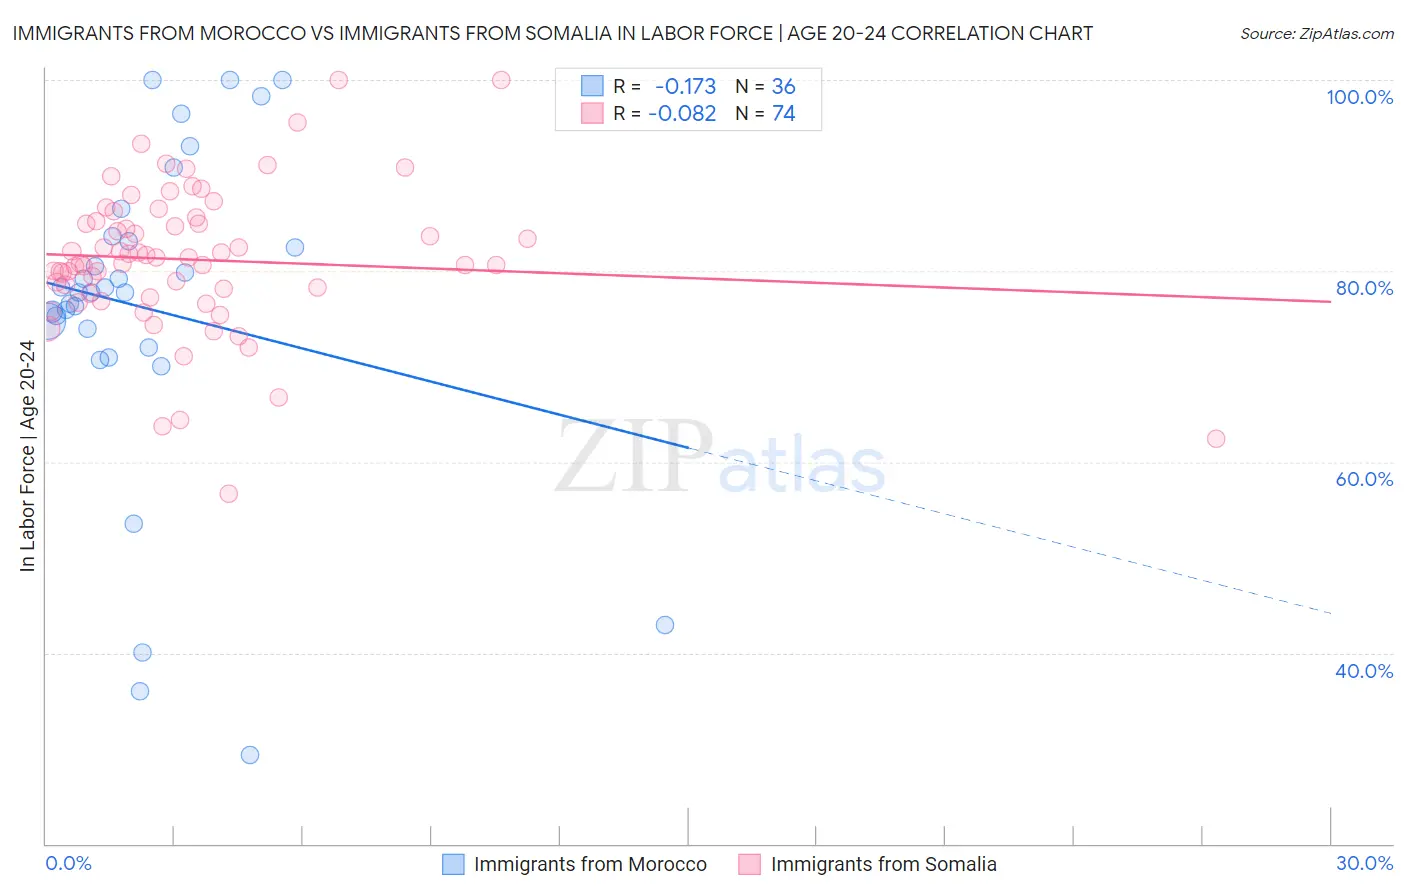
Immigrants from Morocco vs Immigrants from Somalia In Labor Force | Age 20-24 Correlation Chart
The statistical analysis conducted on geographies consisting of 178,862,566 people shows a poor negative correlation between the proportion of Immigrants from Morocco and labor force participation rate among population between the ages 20 and 24 in the United States with a correlation coefficient (R) of -0.173 and weighted average of 75.9%. Similarly, the statistical analysis conducted on geographies consisting of 92,105,737 people shows a slight negative correlation between the proportion of Immigrants from Somalia and labor force participation rate among population between the ages 20 and 24 in the United States with a correlation coefficient (R) of -0.082 and weighted average of 79.5%, a difference of 4.8%.
In Labor Force | Age 20-24 Correlation Summary
| Measurement | Immigrants from Morocco | Immigrants from Somalia |
| Minimum | 29.3% | 56.6% |
| Maximum | 100.0% | 100.0% |
| Range | 70.7% | 43.4% |
| Mean | 76.0% | 81.2% |
| Median | 77.8% | 81.1% |
| Interquartile 25% (IQ1) | 72.9% | 77.7% |
| Interquartile 75% (IQ3) | 83.4% | 85.2% |
| Interquartile Range (IQR) | 10.5% | 7.5% |
| Standard Deviation (Sample) | 17.1% | 7.7% |
| Standard Deviation (Population) | 16.9% | 7.7% |
Similar Demographics by In Labor Force | Age 20-24
Demographics Similar to Immigrants from Morocco by In Labor Force | Age 20-24
In terms of in labor force | age 20-24, the demographic groups most similar to Immigrants from Morocco are Cherokee (75.9%, a difference of 0.0%), Ukrainian (75.9%, a difference of 0.010%), Immigrants from Canada (75.9%, a difference of 0.020%), Immigrants from Netherlands (75.9%, a difference of 0.050%), and Immigrants from Zimbabwe (75.9%, a difference of 0.060%).
| Demographics | Rating | Rank | In Labor Force | Age 20-24 |
| Immigrants | North Macedonia | 97.5 /100 | #103 | Exceptional 76.1% |
| Macedonians | 97.2 /100 | #104 | Exceptional 76.0% |
| Immigrants | Nepal | 97.2 /100 | #105 | Exceptional 76.0% |
| Immigrants | Uganda | 97.1 /100 | #106 | Exceptional 76.0% |
| Greeks | 96.9 /100 | #107 | Exceptional 76.0% |
| Iraqis | 96.6 /100 | #108 | Exceptional 76.0% |
| Cherokee | 95.8 /100 | #109 | Exceptional 75.9% |
| Immigrants | Morocco | 95.8 /100 | #110 | Exceptional 75.9% |
| Ukrainians | 95.7 /100 | #111 | Exceptional 75.9% |
| Immigrants | Canada | 95.6 /100 | #112 | Exceptional 75.9% |
| Immigrants | Netherlands | 95.3 /100 | #113 | Exceptional 75.9% |
| Immigrants | Zimbabwe | 95.1 /100 | #114 | Exceptional 75.9% |
| Alaska Natives | 95.1 /100 | #115 | Exceptional 75.9% |
| Immigrants | North America | 95.0 /100 | #116 | Exceptional 75.9% |
| Assyrians/Chaldeans/Syriacs | 94.9 /100 | #117 | Exceptional 75.9% |
Demographics Similar to Immigrants from Somalia by In Labor Force | Age 20-24
In terms of in labor force | age 20-24, the demographic groups most similar to Immigrants from Somalia are Somali (79.3%, a difference of 0.36%), Alaskan Athabascan (79.1%, a difference of 0.55%), Aleut (79.0%, a difference of 0.69%), Danish (79.0%, a difference of 0.70%), and Luxembourger (79.0%, a difference of 0.74%).
| Demographics | Rating | Rank | In Labor Force | Age 20-24 |
| Norwegians | 100.0 /100 | #1 | Exceptional 80.1% |
| Immigrants | Somalia | 100.0 /100 | #2 | Exceptional 79.5% |
| Somalis | 100.0 /100 | #3 | Exceptional 79.3% |
| Alaskan Athabascans | 100.0 /100 | #4 | Exceptional 79.1% |
| Aleuts | 100.0 /100 | #5 | Exceptional 79.0% |
| Danes | 100.0 /100 | #6 | Exceptional 79.0% |
| Luxembourgers | 100.0 /100 | #7 | Exceptional 79.0% |
| Immigrants | Cabo Verde | 100.0 /100 | #8 | Exceptional 78.9% |
| Swedes | 100.0 /100 | #9 | Exceptional 78.8% |
| Slovenes | 100.0 /100 | #10 | Exceptional 78.7% |
| Finns | 100.0 /100 | #11 | Exceptional 78.7% |
| Germans | 100.0 /100 | #12 | Exceptional 78.6% |
| Scandinavians | 100.0 /100 | #13 | Exceptional 78.5% |
| Czechs | 100.0 /100 | #14 | Exceptional 78.5% |
| Sudanese | 100.0 /100 | #15 | Exceptional 78.4% |