Immigrants from Morocco vs Immigrants from Somalia In Labor Force | Age 30-34
COMPARE
Immigrants from Morocco
Immigrants from Somalia
In Labor Force | Age 30-34
In Labor Force | Age 30-34 Comparison
Immigrants from Morocco
Immigrants from Somalia
85.6%
IN LABOR FORCE | AGE 30-34
99.8/ 100
METRIC RATING
46th/ 347
METRIC RANK
86.2%
IN LABOR FORCE | AGE 30-34
100.0/ 100
METRIC RATING
9th/ 347
METRIC RANK
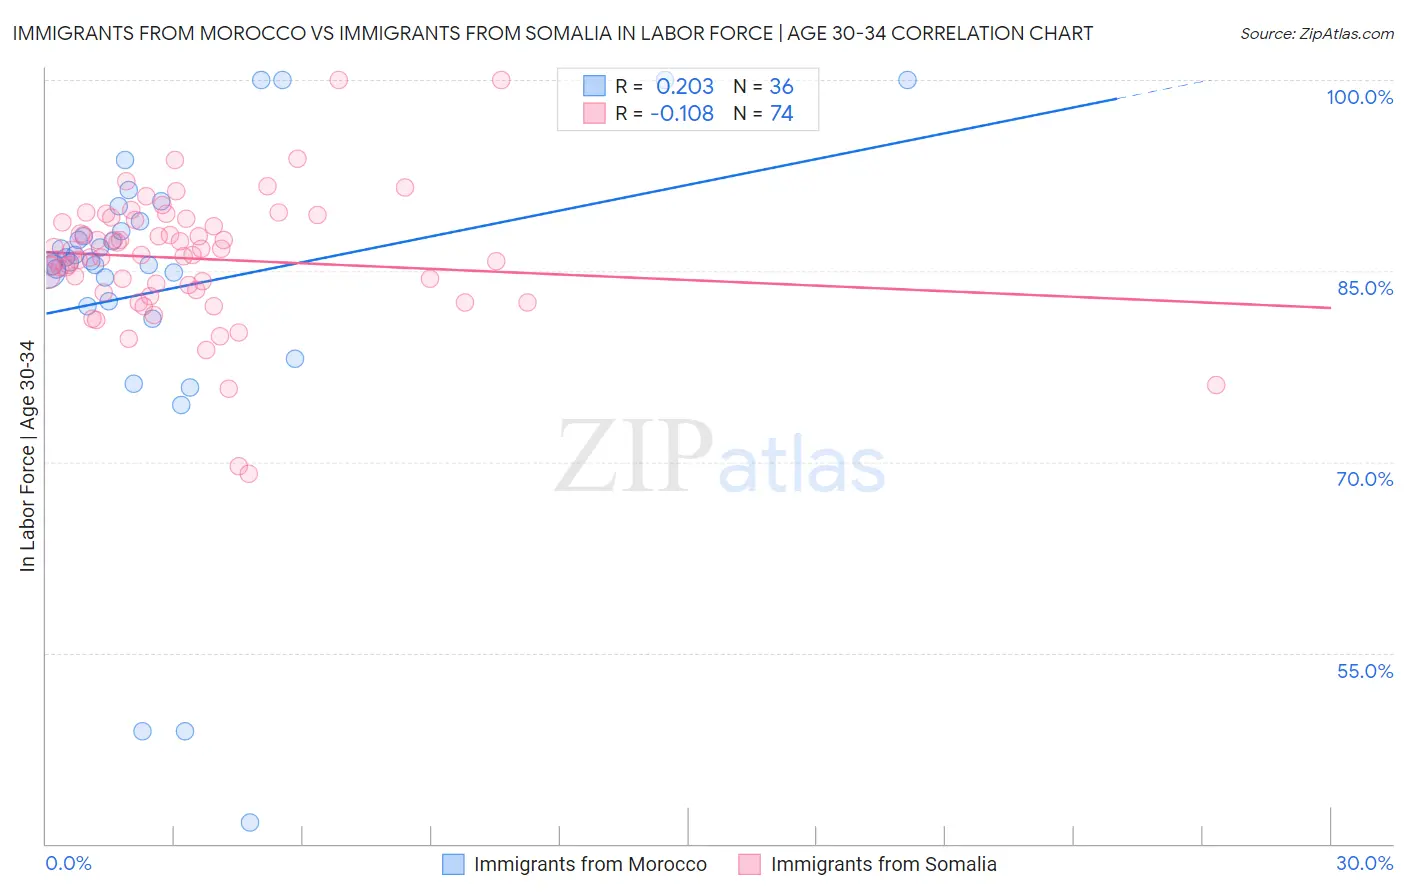
Immigrants from Morocco vs Immigrants from Somalia In Labor Force | Age 30-34 Correlation Chart
The statistical analysis conducted on geographies consisting of 178,904,869 people shows a weak positive correlation between the proportion of Immigrants from Morocco and labor force participation rate among population between the ages 30 and 34 in the United States with a correlation coefficient (R) of 0.203 and weighted average of 85.6%. Similarly, the statistical analysis conducted on geographies consisting of 92,106,685 people shows a poor negative correlation between the proportion of Immigrants from Somalia and labor force participation rate among population between the ages 30 and 34 in the United States with a correlation coefficient (R) of -0.108 and weighted average of 86.2%, a difference of 0.70%.
In Labor Force | Age 30-34 Correlation Summary
| Measurement | Immigrants from Morocco | Immigrants from Somalia |
| Minimum | 41.7% | 69.1% |
| Maximum | 100.0% | 100.0% |
| Range | 58.3% | 30.9% |
| Mean | 83.6% | 86.0% |
| Median | 85.7% | 86.3% |
| Interquartile 25% (IQ1) | 82.4% | 83.5% |
| Interquartile 75% (IQ3) | 88.5% | 89.0% |
| Interquartile Range (IQR) | 6.1% | 5.5% |
| Standard Deviation (Sample) | 13.0% | 5.1% |
| Standard Deviation (Population) | 12.8% | 5.1% |
Similar Demographics by In Labor Force | Age 30-34
Demographics Similar to Immigrants from Morocco by In Labor Force | Age 30-34
In terms of in labor force | age 30-34, the demographic groups most similar to Immigrants from Morocco are Croatian (85.6%, a difference of 0.0%), Immigrants from Sri Lanka (85.6%, a difference of 0.010%), Immigrants from Nepal (85.6%, a difference of 0.010%), Immigrants from Sweden (85.6%, a difference of 0.020%), and Lithuanian (85.6%, a difference of 0.020%).
| Demographics | Rating | Rank | In Labor Force | Age 30-34 |
| Eastern Europeans | 99.9 /100 | #39 | Exceptional 85.7% |
| Turks | 99.9 /100 | #40 | Exceptional 85.7% |
| Immigrants | Italy | 99.9 /100 | #41 | Exceptional 85.7% |
| Zimbabweans | 99.8 /100 | #42 | Exceptional 85.6% |
| Immigrants | Lithuania | 99.8 /100 | #43 | Exceptional 85.6% |
| Immigrants | Sri Lanka | 99.8 /100 | #44 | Exceptional 85.6% |
| Immigrants | Nepal | 99.8 /100 | #45 | Exceptional 85.6% |
| Immigrants | Morocco | 99.8 /100 | #46 | Exceptional 85.6% |
| Croatians | 99.8 /100 | #47 | Exceptional 85.6% |
| Immigrants | Sweden | 99.8 /100 | #48 | Exceptional 85.6% |
| Lithuanians | 99.8 /100 | #49 | Exceptional 85.6% |
| Immigrants | Australia | 99.8 /100 | #50 | Exceptional 85.6% |
| Cape Verdeans | 99.7 /100 | #51 | Exceptional 85.6% |
| Slovenes | 99.7 /100 | #52 | Exceptional 85.6% |
| Filipinos | 99.6 /100 | #53 | Exceptional 85.5% |
Demographics Similar to Immigrants from Somalia by In Labor Force | Age 30-34
In terms of in labor force | age 30-34, the demographic groups most similar to Immigrants from Somalia are Cambodian (86.2%, a difference of 0.010%), Immigrants from Bolivia (86.2%, a difference of 0.020%), Somali (86.2%, a difference of 0.040%), Immigrants from Serbia (86.2%, a difference of 0.040%), and Carpatho Rusyn (86.2%, a difference of 0.040%).
| Demographics | Rating | Rank | In Labor Force | Age 30-34 |
| Ethiopians | 100.0 /100 | #2 | Exceptional 86.6% |
| Immigrants | Ethiopia | 100.0 /100 | #3 | Exceptional 86.6% |
| Liberians | 100.0 /100 | #4 | Exceptional 86.4% |
| Immigrants | Ireland | 100.0 /100 | #5 | Exceptional 86.3% |
| Somalis | 100.0 /100 | #6 | Exceptional 86.2% |
| Immigrants | Bolivia | 100.0 /100 | #7 | Exceptional 86.2% |
| Cambodians | 100.0 /100 | #8 | Exceptional 86.2% |
| Immigrants | Somalia | 100.0 /100 | #9 | Exceptional 86.2% |
| Immigrants | Serbia | 100.0 /100 | #10 | Exceptional 86.2% |
| Carpatho Rusyns | 100.0 /100 | #11 | Exceptional 86.2% |
| Bolivians | 100.0 /100 | #12 | Exceptional 86.1% |
| Immigrants | Croatia | 100.0 /100 | #13 | Exceptional 86.1% |
| Immigrants | Cabo Verde | 100.0 /100 | #14 | Exceptional 86.1% |
| Immigrants | Albania | 100.0 /100 | #15 | Exceptional 86.1% |
| Latvians | 100.0 /100 | #16 | Exceptional 86.0% |