Danish vs Immigrants from Somalia College, 1 year or more
COMPARE
Danish
Immigrants from Somalia
College, 1 year or more
College, 1 year or more Comparison
Danes
Immigrants from Somalia
61.7%
COLLEGE, 1 YEAR OR MORE
94.8/ 100
METRIC RATING
114th/ 347
METRIC RANK
59.7%
COLLEGE, 1 YEAR OR MORE
58.3/ 100
METRIC RATING
163rd/ 347
METRIC RANK
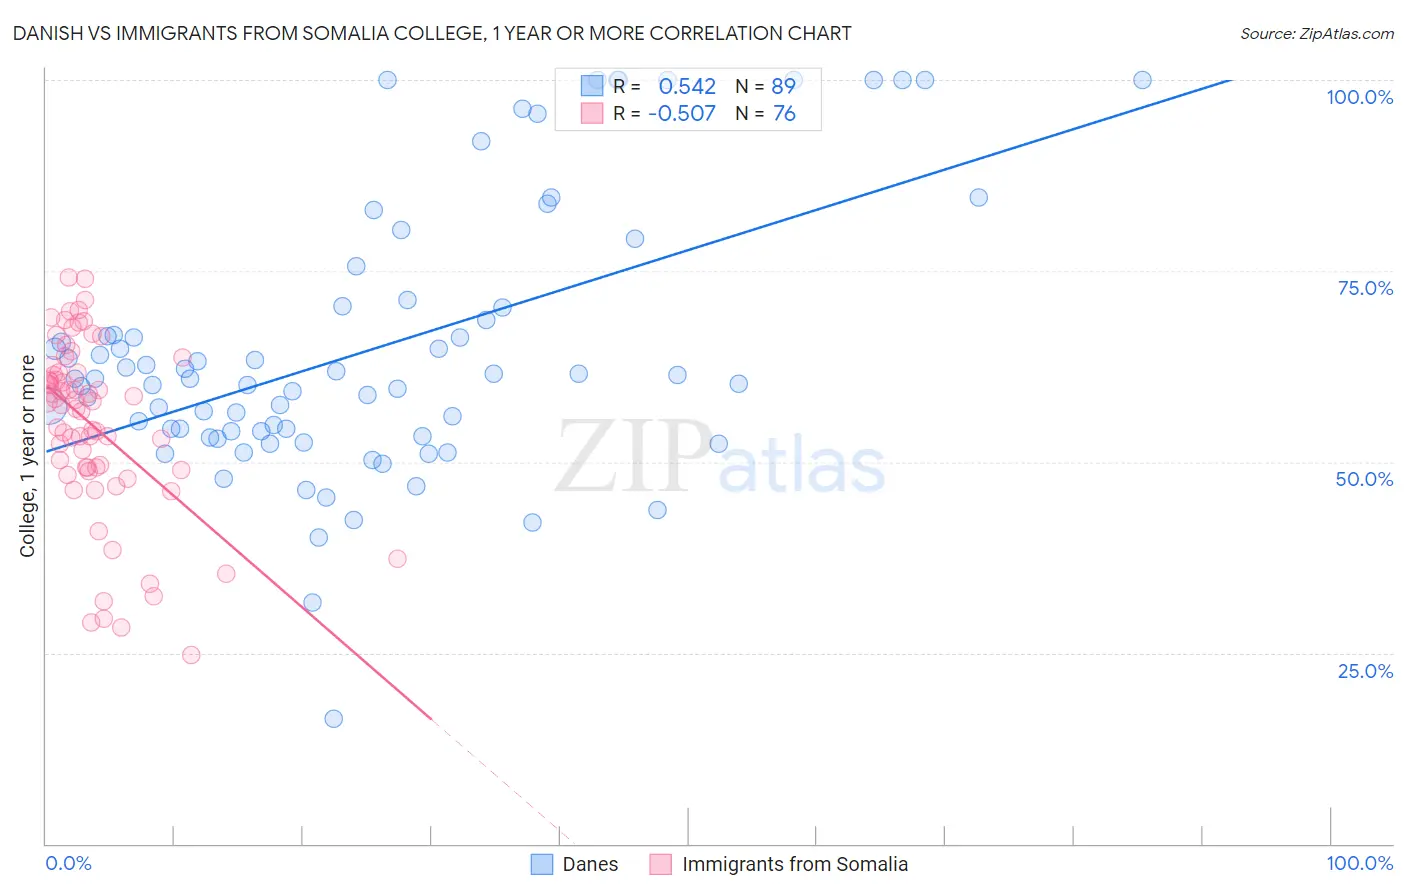
Danish vs Immigrants from Somalia College, 1 year or more Correlation Chart
The statistical analysis conducted on geographies consisting of 474,193,590 people shows a substantial positive correlation between the proportion of Danes and percentage of population with at least college, 1 year or more education in the United States with a correlation coefficient (R) of 0.542 and weighted average of 61.7%. Similarly, the statistical analysis conducted on geographies consisting of 92,111,755 people shows a substantial negative correlation between the proportion of Immigrants from Somalia and percentage of population with at least college, 1 year or more education in the United States with a correlation coefficient (R) of -0.507 and weighted average of 59.7%, a difference of 3.4%.
College, 1 year or more Correlation Summary
| Measurement | Danish | Immigrants from Somalia |
| Minimum | 16.4% | 24.7% |
| Maximum | 100.0% | 74.1% |
| Range | 83.6% | 49.4% |
| Mean | 64.6% | 54.7% |
| Median | 60.9% | 57.6% |
| Interquartile 25% (IQ1) | 53.6% | 49.0% |
| Interquartile 75% (IQ3) | 70.3% | 61.7% |
| Interquartile Range (IQR) | 16.7% | 12.7% |
| Standard Deviation (Sample) | 17.7% | 11.5% |
| Standard Deviation (Population) | 17.6% | 11.4% |
Similar Demographics by College, 1 year or more
Demographics Similar to Danes by College, 1 year or more
In terms of college, 1 year or more, the demographic groups most similar to Danes are Norwegian (61.7%, a difference of 0.070%), Ukrainian (61.8%, a difference of 0.11%), Lebanese (61.6%, a difference of 0.17%), Austrian (61.8%, a difference of 0.18%), and Arab (61.6%, a difference of 0.21%).
| Demographics | Rating | Rank | College, 1 year or more |
| Immigrants | Ukraine | 95.8 /100 | #107 | Exceptional 61.9% |
| Syrians | 95.7 /100 | #108 | Exceptional 61.9% |
| Immigrants | Northern Africa | 95.7 /100 | #109 | Exceptional 61.9% |
| Europeans | 95.6 /100 | #110 | Exceptional 61.8% |
| Macedonians | 95.6 /100 | #111 | Exceptional 61.8% |
| Austrians | 95.4 /100 | #112 | Exceptional 61.8% |
| Ukrainians | 95.2 /100 | #113 | Exceptional 61.8% |
| Danes | 94.8 /100 | #114 | Exceptional 61.7% |
| Norwegians | 94.5 /100 | #115 | Exceptional 61.7% |
| Lebanese | 94.1 /100 | #116 | Exceptional 61.6% |
| Arabs | 93.9 /100 | #117 | Exceptional 61.6% |
| Immigrants | Brazil | 93.9 /100 | #118 | Exceptional 61.6% |
| Assyrians/Chaldeans/Syriacs | 93.3 /100 | #119 | Exceptional 61.5% |
| Pakistanis | 93.2 /100 | #120 | Exceptional 61.5% |
| Immigrants | Jordan | 92.7 /100 | #121 | Exceptional 61.4% |
Demographics Similar to Immigrants from Somalia by College, 1 year or more
In terms of college, 1 year or more, the demographic groups most similar to Immigrants from Somalia are Korean (59.7%, a difference of 0.010%), Belgian (59.7%, a difference of 0.010%), Irish (59.6%, a difference of 0.12%), Immigrants from Africa (59.6%, a difference of 0.12%), and Immigrants from North Macedonia (59.5%, a difference of 0.28%).
| Demographics | Rating | Rank | College, 1 year or more |
| Finns | 72.9 /100 | #156 | Good 60.2% |
| Immigrants | Armenia | 68.8 /100 | #157 | Good 60.0% |
| English | 67.2 /100 | #158 | Good 60.0% |
| Immigrants | Iraq | 67.0 /100 | #159 | Good 60.0% |
| South American Indians | 66.9 /100 | #160 | Good 60.0% |
| Somalis | 64.5 /100 | #161 | Good 59.9% |
| Koreans | 58.5 /100 | #162 | Average 59.7% |
| Immigrants | Somalia | 58.3 /100 | #163 | Average 59.7% |
| Belgians | 58.1 /100 | #164 | Average 59.7% |
| Irish | 56.1 /100 | #165 | Average 59.6% |
| Immigrants | Africa | 56.1 /100 | #166 | Average 59.6% |
| Immigrants | North Macedonia | 53.1 /100 | #167 | Average 59.5% |
| Hungarians | 52.9 /100 | #168 | Average 59.5% |
| Immigrants | Southern Europe | 52.7 /100 | #169 | Average 59.5% |
| Welsh | 52.4 /100 | #170 | Average 59.5% |