Immigrants from South Eastern Asia vs Belizean College, Under 1 year
COMPARE
Immigrants from South Eastern Asia
Belizean
College, Under 1 year
College, Under 1 year Comparison
Immigrants from South Eastern Asia
Belizeans
64.5%
COLLEGE, UNDER 1 YEAR
22.1/ 100
METRIC RATING
195th/ 347
METRIC RANK
60.1%
COLLEGE, UNDER 1 YEAR
0.1/ 100
METRIC RATING
282nd/ 347
METRIC RANK
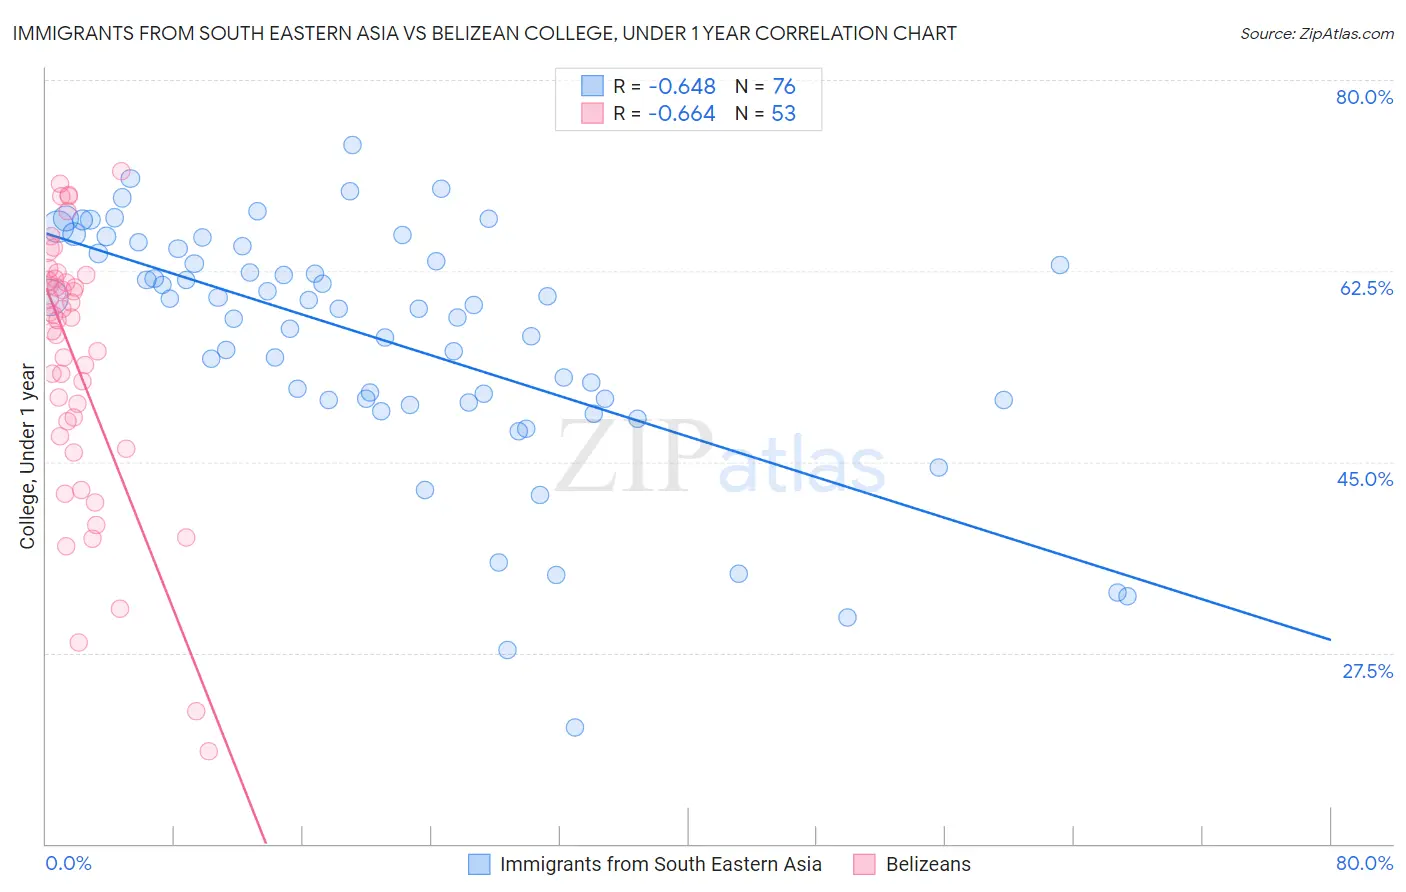
Immigrants from South Eastern Asia vs Belizean College, Under 1 year Correlation Chart
The statistical analysis conducted on geographies consisting of 512,706,379 people shows a significant negative correlation between the proportion of Immigrants from South Eastern Asia and percentage of population with at least college, under 1 year education in the United States with a correlation coefficient (R) of -0.648 and weighted average of 64.5%. Similarly, the statistical analysis conducted on geographies consisting of 144,224,111 people shows a significant negative correlation between the proportion of Belizeans and percentage of population with at least college, under 1 year education in the United States with a correlation coefficient (R) of -0.664 and weighted average of 60.1%, a difference of 7.4%.
College, Under 1 year Correlation Summary
| Measurement | Immigrants from South Eastern Asia | Belizean |
| Minimum | 20.7% | 18.5% |
| Maximum | 74.1% | 71.6% |
| Range | 53.4% | 53.1% |
| Mean | 56.1% | 53.9% |
| Median | 59.2% | 58.0% |
| Interquartile 25% (IQ1) | 50.7% | 46.8% |
| Interquartile 75% (IQ3) | 64.3% | 61.7% |
| Interquartile Range (IQR) | 13.7% | 14.9% |
| Standard Deviation (Sample) | 11.2% | 12.2% |
| Standard Deviation (Population) | 11.1% | 12.1% |
Similar Demographics by College, Under 1 year
Demographics Similar to Immigrants from South Eastern Asia by College, Under 1 year
In terms of college, under 1 year, the demographic groups most similar to Immigrants from South Eastern Asia are Tongan (64.5%, a difference of 0.050%), Immigrants from Cameroon (64.6%, a difference of 0.16%), Costa Rican (64.4%, a difference of 0.17%), Slovak (64.7%, a difference of 0.28%), and Immigrants from Thailand (64.7%, a difference of 0.30%).
| Demographics | Rating | Rank | College, Under 1 year |
| Immigrants | Albania | 32.0 /100 | #188 | Fair 64.9% |
| Spanish | 31.6 /100 | #189 | Fair 64.9% |
| Immigrants | Philippines | 30.1 /100 | #190 | Fair 64.8% |
| Immigrants | Armenia | 28.1 /100 | #191 | Fair 64.7% |
| Immigrants | Thailand | 27.0 /100 | #192 | Fair 64.7% |
| Slovaks | 26.7 /100 | #193 | Fair 64.7% |
| Immigrants | Cameroon | 24.6 /100 | #194 | Fair 64.6% |
| Immigrants | South Eastern Asia | 22.1 /100 | #195 | Fair 64.5% |
| Tongans | 21.2 /100 | #196 | Fair 64.5% |
| Costa Ricans | 19.6 /100 | #197 | Poor 64.4% |
| Tsimshian | 17.9 /100 | #198 | Poor 64.3% |
| Panamanians | 17.0 /100 | #199 | Poor 64.3% |
| Nigerians | 16.7 /100 | #200 | Poor 64.3% |
| French Canadians | 16.3 /100 | #201 | Poor 64.2% |
| South Americans | 16.2 /100 | #202 | Poor 64.2% |
Demographics Similar to Belizeans by College, Under 1 year
In terms of college, under 1 year, the demographic groups most similar to Belizeans are Cherokee (60.1%, a difference of 0.040%), Crow (60.2%, a difference of 0.16%), Ute (60.2%, a difference of 0.25%), Yaqui (60.2%, a difference of 0.26%), and Bahamian (60.3%, a difference of 0.29%).
| Demographics | Rating | Rank | College, Under 1 year |
| Immigrants | Barbados | 0.1 /100 | #275 | Tragic 60.4% |
| Arapaho | 0.1 /100 | #276 | Tragic 60.3% |
| Bahamians | 0.1 /100 | #277 | Tragic 60.3% |
| Yaqui | 0.1 /100 | #278 | Tragic 60.2% |
| Ute | 0.1 /100 | #279 | Tragic 60.2% |
| Crow | 0.1 /100 | #280 | Tragic 60.2% |
| Cherokee | 0.1 /100 | #281 | Tragic 60.1% |
| Belizeans | 0.1 /100 | #282 | Tragic 60.1% |
| Immigrants | Jamaica | 0.0 /100 | #283 | Tragic 59.7% |
| Immigrants | St. Vincent and the Grenadines | 0.0 /100 | #284 | Tragic 59.6% |
| Paiute | 0.0 /100 | #285 | Tragic 59.6% |
| British West Indians | 0.0 /100 | #286 | Tragic 59.5% |
| Sioux | 0.0 /100 | #287 | Tragic 59.4% |
| Blacks/African Americans | 0.0 /100 | #288 | Tragic 59.4% |
| Choctaw | 0.0 /100 | #289 | Tragic 59.3% |