Immigrants from Morocco vs Belizean Median Male Earnings
COMPARE
Immigrants from Morocco
Belizean
Median Male Earnings
Median Male Earnings Comparison
Immigrants from Morocco
Belizeans
$56,958
MEDIAN MALE EARNINGS
91.8/ 100
METRIC RATING
125th/ 347
METRIC RANK
$48,358
MEDIAN MALE EARNINGS
0.2/ 100
METRIC RATING
277th/ 347
METRIC RANK
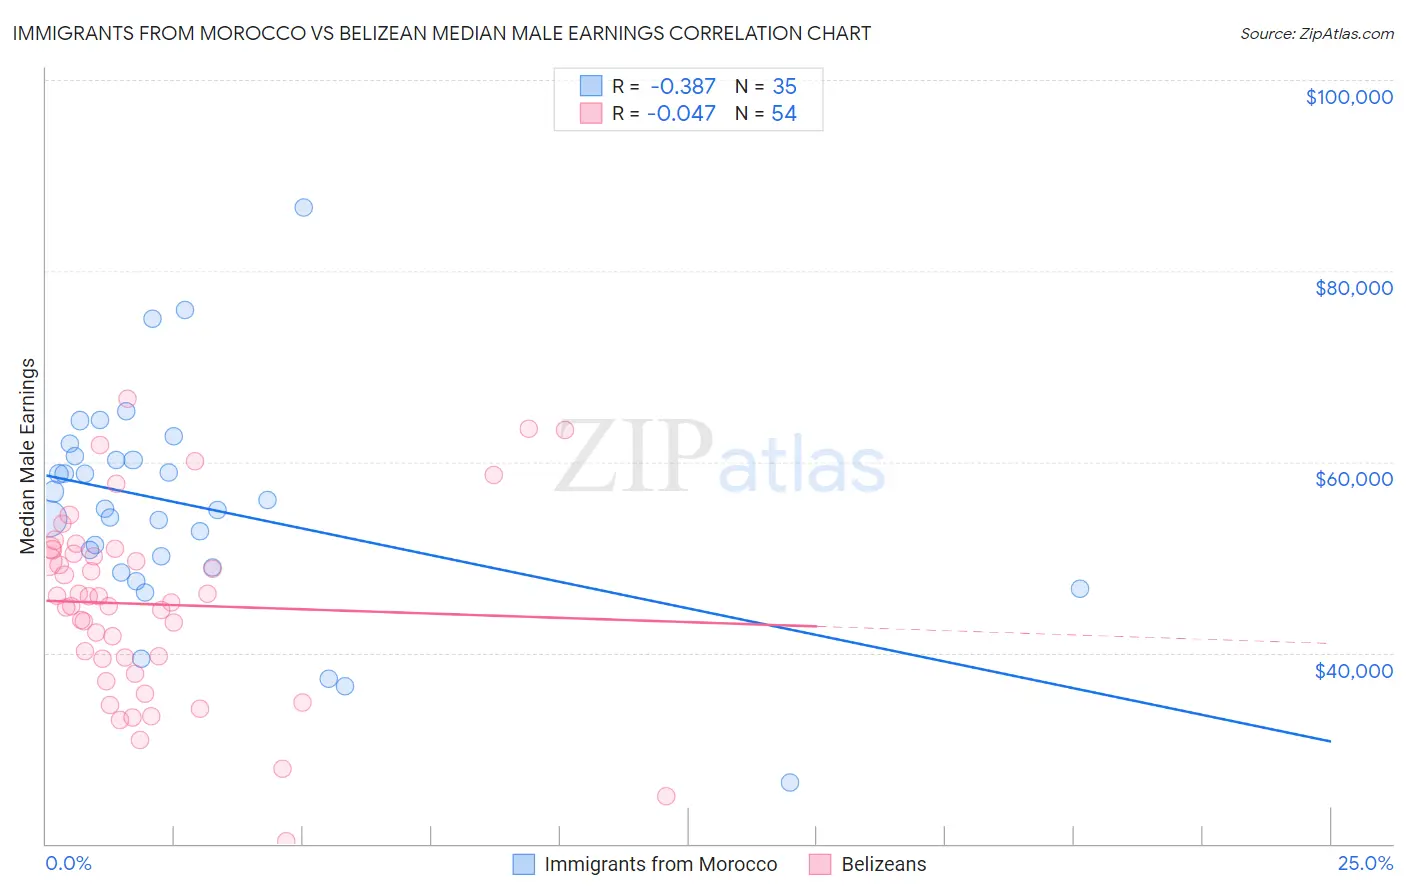
Immigrants from Morocco vs Belizean Median Male Earnings Correlation Chart
The statistical analysis conducted on geographies consisting of 178,898,918 people shows a mild negative correlation between the proportion of Immigrants from Morocco and median male earnings in the United States with a correlation coefficient (R) of -0.387 and weighted average of $56,958. Similarly, the statistical analysis conducted on geographies consisting of 144,207,760 people shows no correlation between the proportion of Belizeans and median male earnings in the United States with a correlation coefficient (R) of -0.047 and weighted average of $48,358, a difference of 17.8%.
Median Male Earnings Correlation Summary
| Measurement | Immigrants from Morocco | Belizean |
| Minimum | $26,429 | $20,292 |
| Maximum | $86,602 | $66,580 |
| Range | $60,173 | $46,288 |
| Mean | $55,429 | $45,078 |
| Median | $55,129 | $45,641 |
| Interquartile 25% (IQ1) | $49,000 | $39,349 |
| Interquartile 75% (IQ3) | $60,575 | $50,831 |
| Interquartile Range (IQR) | $11,575 | $11,482 |
| Standard Deviation (Sample) | $11,412 | $9,817 |
| Standard Deviation (Population) | $11,248 | $9,725 |
Similar Demographics by Median Male Earnings
Demographics Similar to Immigrants from Morocco by Median Male Earnings
In terms of median male earnings, the demographic groups most similar to Immigrants from Morocco are Chilean ($56,973, a difference of 0.030%), Chinese ($56,872, a difference of 0.15%), Brazilian ($56,837, a difference of 0.21%), Immigrants from Syria ($56,830, a difference of 0.23%), and Immigrants from Jordan ($57,145, a difference of 0.33%).
| Demographics | Rating | Rank | Median Male Earnings |
| Hungarians | 94.0 /100 | #118 | Exceptional $57,309 |
| Arabs | 94.0 /100 | #119 | Exceptional $57,298 |
| Canadians | 93.9 /100 | #120 | Exceptional $57,286 |
| Immigrants | Albania | 93.3 /100 | #121 | Exceptional $57,179 |
| Immigrants | Jordan | 93.1 /100 | #122 | Exceptional $57,145 |
| Slovenes | 93.1 /100 | #123 | Exceptional $57,145 |
| Chileans | 91.9 /100 | #124 | Exceptional $56,973 |
| Immigrants | Morocco | 91.8 /100 | #125 | Exceptional $56,958 |
| Chinese | 91.1 /100 | #126 | Exceptional $56,872 |
| Brazilians | 90.9 /100 | #127 | Exceptional $56,837 |
| Immigrants | Syria | 90.8 /100 | #128 | Exceptional $56,830 |
| Pakistanis | 89.9 /100 | #129 | Excellent $56,719 |
| Koreans | 89.4 /100 | #130 | Excellent $56,672 |
| Portuguese | 89.4 /100 | #131 | Excellent $56,663 |
| Czechs | 88.2 /100 | #132 | Excellent $56,546 |
Demographics Similar to Belizeans by Median Male Earnings
In terms of median male earnings, the demographic groups most similar to Belizeans are Immigrants from Liberia ($48,317, a difference of 0.080%), Blackfeet ($48,402, a difference of 0.090%), Immigrants from Somalia ($48,439, a difference of 0.17%), Hmong ($48,254, a difference of 0.22%), and Comanche ($48,202, a difference of 0.32%).
| Demographics | Rating | Rank | Median Male Earnings |
| Potawatomi | 0.4 /100 | #270 | Tragic $48,768 |
| Cherokee | 0.3 /100 | #271 | Tragic $48,669 |
| Salvadorans | 0.3 /100 | #272 | Tragic $48,646 |
| Jamaicans | 0.3 /100 | #273 | Tragic $48,632 |
| Colville | 0.3 /100 | #274 | Tragic $48,516 |
| Immigrants | Somalia | 0.3 /100 | #275 | Tragic $48,439 |
| Blackfeet | 0.3 /100 | #276 | Tragic $48,402 |
| Belizeans | 0.2 /100 | #277 | Tragic $48,358 |
| Immigrants | Liberia | 0.2 /100 | #278 | Tragic $48,317 |
| Hmong | 0.2 /100 | #279 | Tragic $48,254 |
| Comanche | 0.2 /100 | #280 | Tragic $48,202 |
| Marshallese | 0.2 /100 | #281 | Tragic $48,137 |
| Central Americans | 0.2 /100 | #282 | Tragic $48,093 |
| Immigrants | Jamaica | 0.2 /100 | #283 | Tragic $48,040 |
| Africans | 0.2 /100 | #284 | Tragic $47,994 |