Immigrants from Micronesia vs Arapaho Child Poverty Under the Age of 5
COMPARE
Immigrants from Micronesia
Arapaho
Child Poverty Under the Age of 5
Child Poverty Under the Age of 5 Comparison
Immigrants from Micronesia
Arapaho
19.4%
CHILD POVERTY UNDER THE AGE OF 5
0.9/ 100
METRIC RATING
234th/ 347
METRIC RANK
23.1%
CHILD POVERTY UNDER THE AGE OF 5
0.0/ 100
METRIC RATING
315th/ 347
METRIC RANK
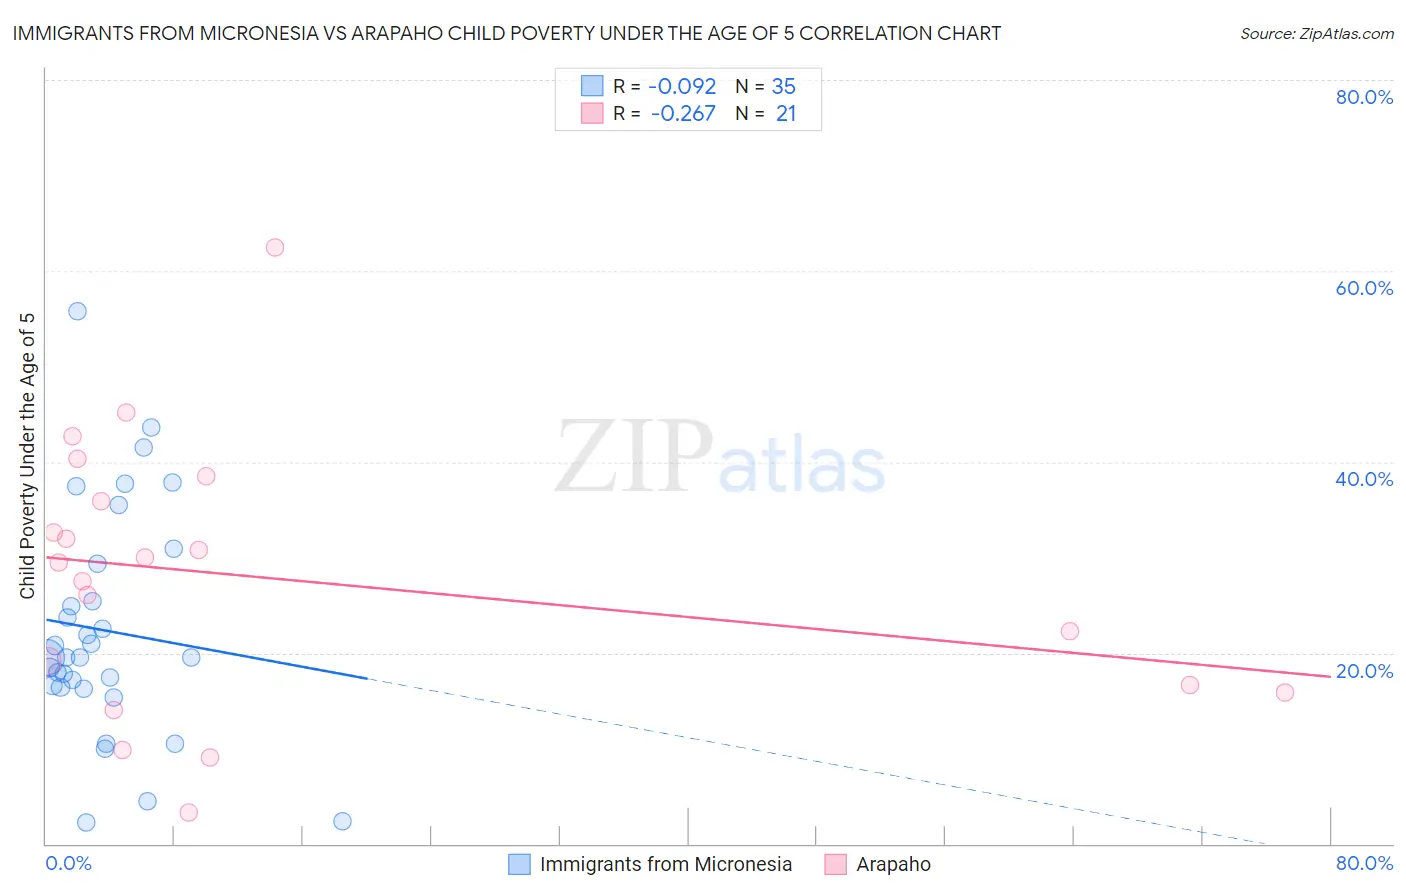
Immigrants from Micronesia vs Arapaho Child Poverty Under the Age of 5 Correlation Chart
The statistical analysis conducted on geographies consisting of 61,294,346 people shows a slight negative correlation between the proportion of Immigrants from Micronesia and poverty level among children under the age of 5 in the United States with a correlation coefficient (R) of -0.092 and weighted average of 19.4%. Similarly, the statistical analysis conducted on geographies consisting of 29,632,672 people shows a weak negative correlation between the proportion of Arapaho and poverty level among children under the age of 5 in the United States with a correlation coefficient (R) of -0.267 and weighted average of 23.1%, a difference of 19.4%.
Child Poverty Under the Age of 5 Correlation Summary
| Measurement | Immigrants from Micronesia | Arapaho |
| Minimum | 2.3% | 3.3% |
| Maximum | 55.8% | 62.5% |
| Range | 53.5% | 59.2% |
| Mean | 22.3% | 27.8% |
| Median | 19.5% | 29.5% |
| Interquartile 25% (IQ1) | 16.4% | 16.3% |
| Interquartile 75% (IQ3) | 29.4% | 37.2% |
| Interquartile Range (IQR) | 12.9% | 20.9% |
| Standard Deviation (Sample) | 11.9% | 14.1% |
| Standard Deviation (Population) | 11.7% | 13.7% |
Similar Demographics by Child Poverty Under the Age of 5
Demographics Similar to Immigrants from Micronesia by Child Poverty Under the Age of 5
In terms of child poverty under the age of 5, the demographic groups most similar to Immigrants from Micronesia are Sudanese (19.3%, a difference of 0.12%), Trinidadian and Tobagonian (19.3%, a difference of 0.18%), Immigrants from Laos (19.4%, a difference of 0.21%), Immigrants from Trinidad and Tobago (19.4%, a difference of 0.21%), and Bermudan (19.2%, a difference of 0.74%).
| Demographics | Rating | Rank | Child Poverty Under the Age of 5 |
| Cape Verdeans | 1.4 /100 | #227 | Tragic 19.1% |
| Immigrants | Sudan | 1.3 /100 | #228 | Tragic 19.2% |
| Ghanaians | 1.2 /100 | #229 | Tragic 19.2% |
| Ecuadorians | 1.2 /100 | #230 | Tragic 19.2% |
| Bermudans | 1.2 /100 | #231 | Tragic 19.2% |
| Trinidadians and Tobagonians | 0.9 /100 | #232 | Tragic 19.3% |
| Sudanese | 0.9 /100 | #233 | Tragic 19.3% |
| Immigrants | Micronesia | 0.9 /100 | #234 | Tragic 19.4% |
| Immigrants | Laos | 0.8 /100 | #235 | Tragic 19.4% |
| Immigrants | Trinidad and Tobago | 0.8 /100 | #236 | Tragic 19.4% |
| Immigrants | Cabo Verde | 0.6 /100 | #237 | Tragic 19.5% |
| Salvadorans | 0.6 /100 | #238 | Tragic 19.5% |
| Vietnamese | 0.6 /100 | #239 | Tragic 19.5% |
| Immigrants | Ecuador | 0.5 /100 | #240 | Tragic 19.6% |
| Alaska Natives | 0.5 /100 | #241 | Tragic 19.6% |
Demographics Similar to Arapaho by Child Poverty Under the Age of 5
In terms of child poverty under the age of 5, the demographic groups most similar to Arapaho are Yakama (23.1%, a difference of 0.12%), U.S. Virgin Islander (23.0%, a difference of 0.56%), Menominee (23.3%, a difference of 0.62%), Bahamian (23.0%, a difference of 0.65%), and Honduran (23.0%, a difference of 0.70%).
| Demographics | Rating | Rank | Child Poverty Under the Age of 5 |
| Immigrants | Dominica | 0.0 /100 | #308 | Tragic 22.7% |
| Houma | 0.0 /100 | #309 | Tragic 22.7% |
| Africans | 0.0 /100 | #310 | Tragic 22.8% |
| Seminole | 0.0 /100 | #311 | Tragic 22.8% |
| Hondurans | 0.0 /100 | #312 | Tragic 23.0% |
| Bahamians | 0.0 /100 | #313 | Tragic 23.0% |
| U.S. Virgin Islanders | 0.0 /100 | #314 | Tragic 23.0% |
| Arapaho | 0.0 /100 | #315 | Tragic 23.1% |
| Yakama | 0.0 /100 | #316 | Tragic 23.1% |
| Menominee | 0.0 /100 | #317 | Tragic 23.3% |
| Dutch West Indians | 0.0 /100 | #318 | Tragic 23.3% |
| Chippewa | 0.0 /100 | #319 | Tragic 23.4% |
| Choctaw | 0.0 /100 | #320 | Tragic 23.5% |
| Immigrants | Honduras | 0.0 /100 | #321 | Tragic 23.5% |
| Ute | 0.0 /100 | #322 | Tragic 23.5% |