Immigrants from Lebanon vs Immigrants from Lithuania Ambulatory Disability
COMPARE
Immigrants from Lebanon
Immigrants from Lithuania
Ambulatory Disability
Ambulatory Disability Comparison
Immigrants from Lebanon
Immigrants from Lithuania
5.8%
AMBULATORY DISABILITY
98.3/ 100
METRIC RATING
98th/ 347
METRIC RANK
5.6%
AMBULATORY DISABILITY
99.8/ 100
METRIC RATING
60th/ 347
METRIC RANK
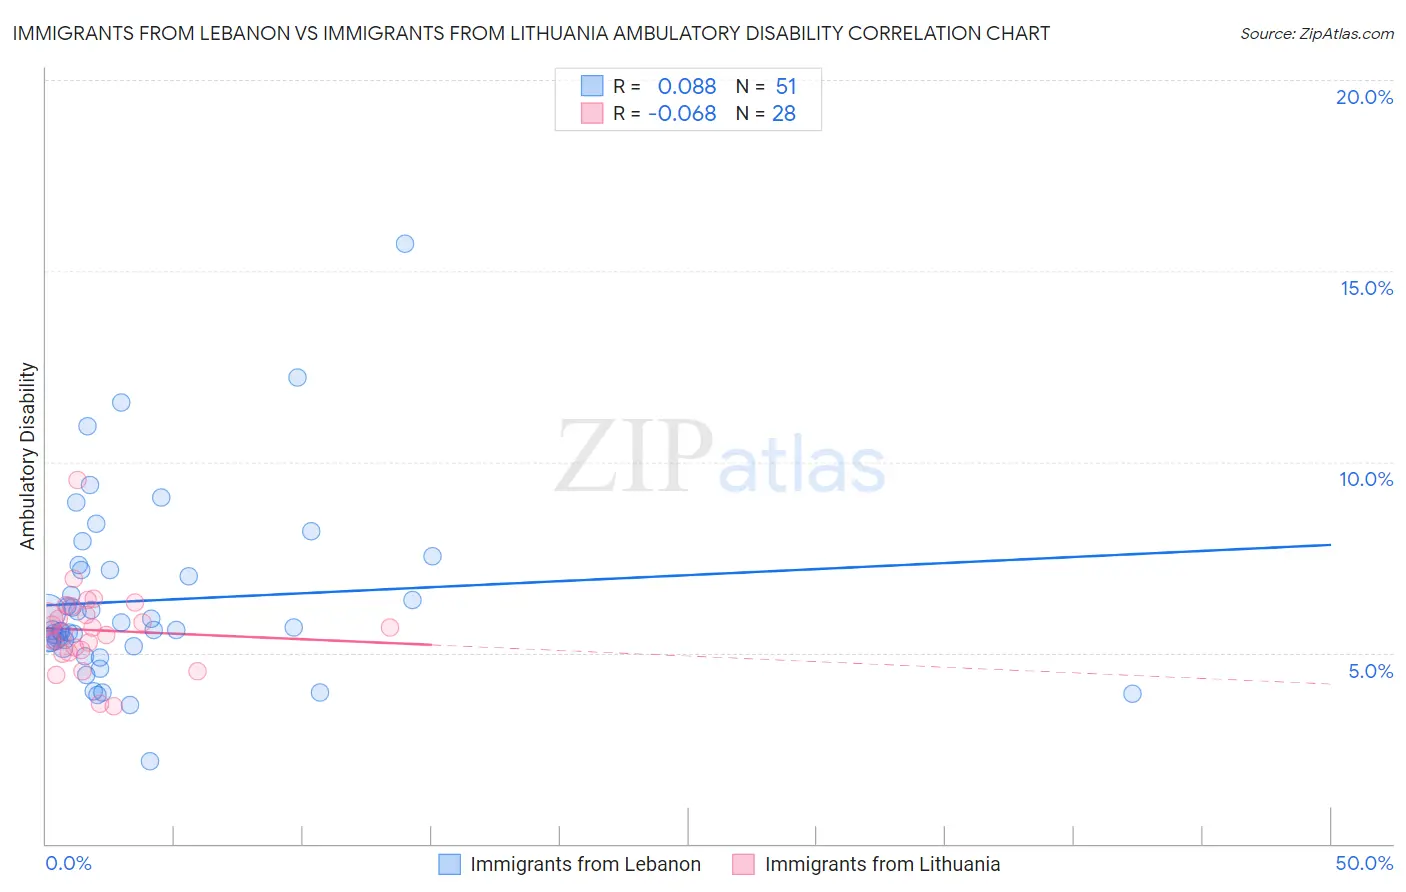
Immigrants from Lebanon vs Immigrants from Lithuania Ambulatory Disability Correlation Chart
The statistical analysis conducted on geographies consisting of 217,147,801 people shows a slight positive correlation between the proportion of Immigrants from Lebanon and percentage of population with ambulatory disability in the United States with a correlation coefficient (R) of 0.088 and weighted average of 5.8%. Similarly, the statistical analysis conducted on geographies consisting of 117,713,012 people shows a slight negative correlation between the proportion of Immigrants from Lithuania and percentage of population with ambulatory disability in the United States with a correlation coefficient (R) of -0.068 and weighted average of 5.6%, a difference of 2.8%.
Ambulatory Disability Correlation Summary
| Measurement | Immigrants from Lebanon | Immigrants from Lithuania |
| Minimum | 2.2% | 3.6% |
| Maximum | 15.7% | 9.5% |
| Range | 13.6% | 5.9% |
| Mean | 6.4% | 5.6% |
| Median | 5.6% | 5.6% |
| Interquartile 25% (IQ1) | 5.2% | 5.0% |
| Interquartile 75% (IQ3) | 7.2% | 6.1% |
| Interquartile Range (IQR) | 2.0% | 1.1% |
| Standard Deviation (Sample) | 2.4% | 1.1% |
| Standard Deviation (Population) | 2.4% | 1.1% |
Similar Demographics by Ambulatory Disability
Demographics Similar to Immigrants from Lebanon by Ambulatory Disability
In terms of ambulatory disability, the demographic groups most similar to Immigrants from Lebanon are Immigrants from Somalia (5.8%, a difference of 0.020%), Salvadoran (5.8%, a difference of 0.070%), Immigrants from El Salvador (5.8%, a difference of 0.090%), Immigrants from Northern Europe (5.8%, a difference of 0.090%), and Kenyan (5.8%, a difference of 0.12%).
| Demographics | Rating | Rank | Ambulatory Disability |
| Immigrants | Sudan | 98.8 /100 | #91 | Exceptional 5.8% |
| Immigrants | Sierra Leone | 98.6 /100 | #92 | Exceptional 5.8% |
| Immigrants | Denmark | 98.6 /100 | #93 | Exceptional 5.8% |
| Kenyans | 98.4 /100 | #94 | Exceptional 5.8% |
| Immigrants | El Salvador | 98.4 /100 | #95 | Exceptional 5.8% |
| Salvadorans | 98.4 /100 | #96 | Exceptional 5.8% |
| Immigrants | Somalia | 98.3 /100 | #97 | Exceptional 5.8% |
| Immigrants | Lebanon | 98.3 /100 | #98 | Exceptional 5.8% |
| Immigrants | Northern Europe | 98.2 /100 | #99 | Exceptional 5.8% |
| Immigrants | Serbia | 97.9 /100 | #100 | Exceptional 5.8% |
| Immigrants | South America | 97.9 /100 | #101 | Exceptional 5.8% |
| Immigrants | Kenya | 97.8 /100 | #102 | Exceptional 5.8% |
| Immigrants | Romania | 97.7 /100 | #103 | Exceptional 5.8% |
| New Zealanders | 97.6 /100 | #104 | Exceptional 5.8% |
| Immigrants | Czechoslovakia | 97.4 /100 | #105 | Exceptional 5.8% |
Demographics Similar to Immigrants from Lithuania by Ambulatory Disability
In terms of ambulatory disability, the demographic groups most similar to Immigrants from Lithuania are Immigrants from Afghanistan (5.6%, a difference of 0.040%), Immigrants from Zimbabwe (5.6%, a difference of 0.080%), Immigrants from Belgium (5.6%, a difference of 0.12%), Immigrants from Spain (5.6%, a difference of 0.13%), and Immigrants from Brazil (5.6%, a difference of 0.14%).
| Demographics | Rating | Rank | Ambulatory Disability |
| Immigrants | Egypt | 99.8 /100 | #53 | Exceptional 5.6% |
| Immigrants | Eastern Africa | 99.8 /100 | #54 | Exceptional 5.6% |
| Immigrants | Bulgaria | 99.8 /100 | #55 | Exceptional 5.6% |
| Inupiat | 99.8 /100 | #56 | Exceptional 5.6% |
| Immigrants | Brazil | 99.8 /100 | #57 | Exceptional 5.6% |
| Immigrants | Zimbabwe | 99.8 /100 | #58 | Exceptional 5.6% |
| Immigrants | Afghanistan | 99.8 /100 | #59 | Exceptional 5.6% |
| Immigrants | Lithuania | 99.8 /100 | #60 | Exceptional 5.6% |
| Immigrants | Belgium | 99.7 /100 | #61 | Exceptional 5.6% |
| Immigrants | Spain | 99.7 /100 | #62 | Exceptional 5.6% |
| Immigrants | France | 99.7 /100 | #63 | Exceptional 5.6% |
| Laotians | 99.7 /100 | #64 | Exceptional 5.7% |
| Immigrants | Switzerland | 99.7 /100 | #65 | Exceptional 5.7% |
| Israelis | 99.6 /100 | #66 | Exceptional 5.7% |
| Immigrants | Uganda | 99.6 /100 | #67 | Exceptional 5.7% |