Immigrants from Lebanon vs Immigrants from Lithuania Poverty
COMPARE
Immigrants from Lebanon
Immigrants from Lithuania
Poverty
Poverty Comparison
Immigrants from Lebanon
Immigrants from Lithuania
12.8%
POVERTY
18.7/ 100
METRIC RATING
197th/ 347
METRIC RANK
10.3%
POVERTY
99.9/ 100
METRIC RATING
11th/ 347
METRIC RANK
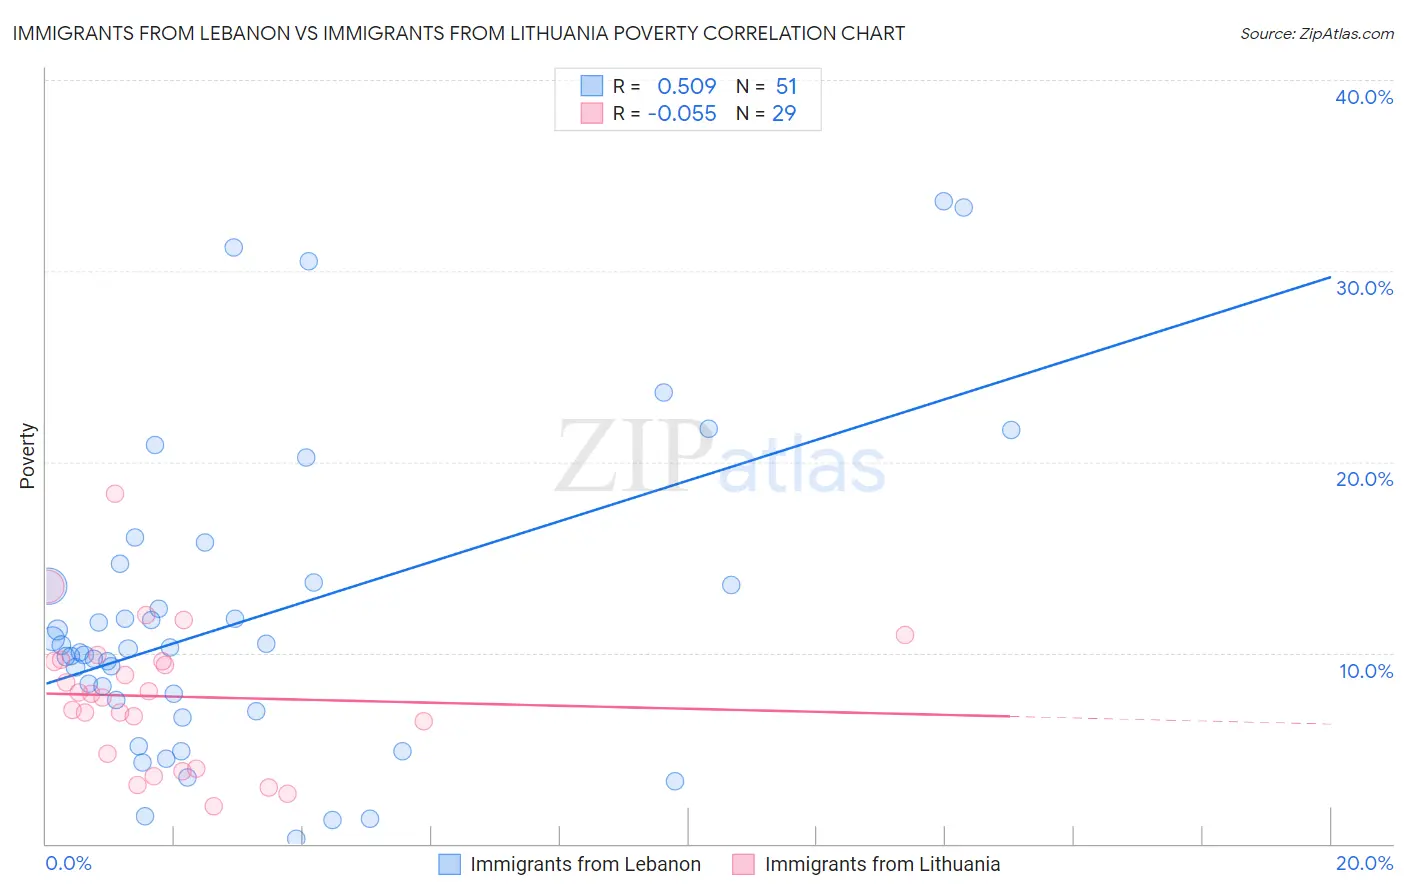
Immigrants from Lebanon vs Immigrants from Lithuania Poverty Correlation Chart
The statistical analysis conducted on geographies consisting of 217,129,888 people shows a substantial positive correlation between the proportion of Immigrants from Lebanon and poverty level in the United States with a correlation coefficient (R) of 0.509 and weighted average of 12.8%. Similarly, the statistical analysis conducted on geographies consisting of 117,712,051 people shows a slight negative correlation between the proportion of Immigrants from Lithuania and poverty level in the United States with a correlation coefficient (R) of -0.055 and weighted average of 10.3%, a difference of 23.3%.
Poverty Correlation Summary
| Measurement | Immigrants from Lebanon | Immigrants from Lithuania |
| Minimum | 0.24% | 2.0% |
| Maximum | 33.6% | 18.3% |
| Range | 33.4% | 16.4% |
| Mean | 11.8% | 7.7% |
| Median | 10.2% | 7.9% |
| Interquartile 25% (IQ1) | 6.9% | 4.3% |
| Interquartile 75% (IQ3) | 13.7% | 9.6% |
| Interquartile Range (IQR) | 6.8% | 5.3% |
| Standard Deviation (Sample) | 8.0% | 3.7% |
| Standard Deviation (Population) | 7.9% | 3.6% |
Similar Demographics by Poverty
Demographics Similar to Immigrants from Lebanon by Poverty
In terms of poverty, the demographic groups most similar to Immigrants from Lebanon are Spanish (12.8%, a difference of 0.010%), Immigrants from Kenya (12.8%, a difference of 0.20%), Iraqi (12.7%, a difference of 0.31%), Immigrants from Kuwait (12.7%, a difference of 0.32%), and Spaniard (12.8%, a difference of 0.35%).
| Demographics | Rating | Rank | Poverty |
| Immigrants | South America | 32.3 /100 | #190 | Fair 12.5% |
| Sierra Leoneans | 31.5 /100 | #191 | Fair 12.6% |
| South American Indians | 23.3 /100 | #192 | Fair 12.7% |
| Delaware | 21.4 /100 | #193 | Fair 12.7% |
| Arabs | 21.1 /100 | #194 | Fair 12.7% |
| Immigrants | Kuwait | 20.9 /100 | #195 | Fair 12.7% |
| Iraqis | 20.8 /100 | #196 | Fair 12.7% |
| Immigrants | Lebanon | 18.7 /100 | #197 | Poor 12.8% |
| Spanish | 18.7 /100 | #198 | Poor 12.8% |
| Immigrants | Kenya | 17.5 /100 | #199 | Poor 12.8% |
| Spaniards | 16.5 /100 | #200 | Poor 12.8% |
| Immigrants | Uganda | 16.5 /100 | #201 | Poor 12.8% |
| Immigrants | Uruguay | 15.6 /100 | #202 | Poor 12.8% |
| Hmong | 15.0 /100 | #203 | Poor 12.8% |
| Immigrants | Western Asia | 14.1 /100 | #204 | Poor 12.9% |
Demographics Similar to Immigrants from Lithuania by Poverty
In terms of poverty, the demographic groups most similar to Immigrants from Lithuania are Bhutanese (10.4%, a difference of 0.35%), Immigrants from Hong Kong (10.4%, a difference of 0.57%), Immigrants from Bolivia (10.4%, a difference of 0.89%), Bolivian (10.4%, a difference of 0.89%), and Bulgarian (10.2%, a difference of 0.99%).
| Demographics | Rating | Rank | Poverty |
| Immigrants | Taiwan | 100.0 /100 | #4 | Exceptional 9.7% |
| Immigrants | Ireland | 99.9 /100 | #5 | Exceptional 10.1% |
| Assyrians/Chaldeans/Syriacs | 99.9 /100 | #6 | Exceptional 10.1% |
| Filipinos | 99.9 /100 | #7 | Exceptional 10.1% |
| Maltese | 99.9 /100 | #8 | Exceptional 10.2% |
| Immigrants | South Central Asia | 99.9 /100 | #9 | Exceptional 10.2% |
| Bulgarians | 99.9 /100 | #10 | Exceptional 10.2% |
| Immigrants | Lithuania | 99.9 /100 | #11 | Exceptional 10.3% |
| Bhutanese | 99.8 /100 | #12 | Exceptional 10.4% |
| Immigrants | Hong Kong | 99.8 /100 | #13 | Exceptional 10.4% |
| Immigrants | Bolivia | 99.8 /100 | #14 | Exceptional 10.4% |
| Bolivians | 99.8 /100 | #15 | Exceptional 10.4% |
| Lithuanians | 99.8 /100 | #16 | Exceptional 10.5% |
| Norwegians | 99.8 /100 | #17 | Exceptional 10.5% |
| Latvians | 99.8 /100 | #18 | Exceptional 10.5% |