Tlingit-Haida vs South American College, Under 1 year
COMPARE
Tlingit-Haida
South American
College, Under 1 year
College, Under 1 year Comparison
Tlingit-Haida
South Americans
65.9%
COLLEGE, UNDER 1 YEAR
66.4/ 100
METRIC RATING
159th/ 347
METRIC RANK
64.2%
COLLEGE, UNDER 1 YEAR
16.2/ 100
METRIC RATING
202nd/ 347
METRIC RANK
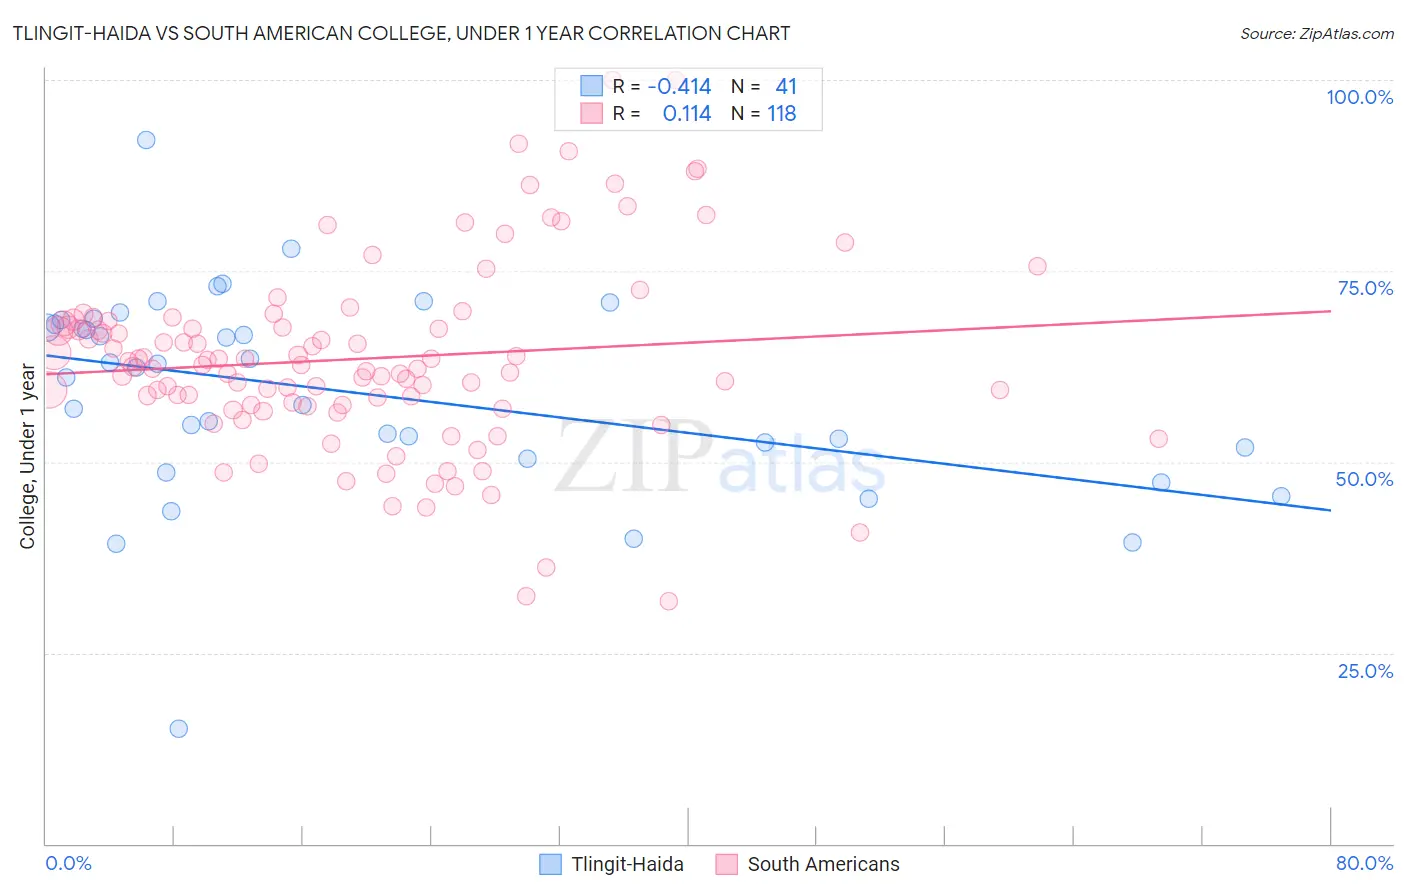
Tlingit-Haida vs South American College, Under 1 year Correlation Chart
The statistical analysis conducted on geographies consisting of 60,871,919 people shows a moderate negative correlation between the proportion of Tlingit-Haida and percentage of population with at least college, under 1 year education in the United States with a correlation coefficient (R) of -0.414 and weighted average of 65.9%. Similarly, the statistical analysis conducted on geographies consisting of 494,173,553 people shows a poor positive correlation between the proportion of South Americans and percentage of population with at least college, under 1 year education in the United States with a correlation coefficient (R) of 0.114 and weighted average of 64.2%, a difference of 2.6%.
College, Under 1 year Correlation Summary
| Measurement | Tlingit-Haida | South American |
| Minimum | 15.0% | 31.8% |
| Maximum | 92.1% | 100.0% |
| Range | 77.1% | 68.2% |
| Mean | 59.1% | 63.5% |
| Median | 62.3% | 62.6% |
| Interquartile 25% (IQ1) | 51.2% | 57.4% |
| Interquartile 75% (IQ3) | 68.3% | 68.1% |
| Interquartile Range (IQR) | 17.2% | 10.7% |
| Standard Deviation (Sample) | 13.5% | 12.3% |
| Standard Deviation (Population) | 13.4% | 12.3% |
Similar Demographics by College, Under 1 year
Demographics Similar to Tlingit-Haida by College, Under 1 year
In terms of college, under 1 year, the demographic groups most similar to Tlingit-Haida are Albanian (65.9%, a difference of 0.010%), Brazilian (65.9%, a difference of 0.020%), Celtic (65.9%, a difference of 0.050%), Korean (65.9%, a difference of 0.050%), and Sierra Leonean (66.0%, a difference of 0.070%).
| Demographics | Rating | Rank | College, Under 1 year |
| Sudanese | 74.1 /100 | #152 | Good 66.2% |
| Belgians | 73.7 /100 | #153 | Good 66.2% |
| Immigrants | Eritrea | 71.9 /100 | #154 | Good 66.1% |
| Irish | 70.3 /100 | #155 | Good 66.0% |
| Welsh | 69.9 /100 | #156 | Good 66.0% |
| Sierra Leoneans | 67.8 /100 | #157 | Good 66.0% |
| Celtics | 67.3 /100 | #158 | Good 65.9% |
| Tlingit-Haida | 66.4 /100 | #159 | Good 65.9% |
| Albanians | 66.1 /100 | #160 | Good 65.9% |
| Brazilians | 66.0 /100 | #161 | Good 65.9% |
| Koreans | 65.3 /100 | #162 | Good 65.9% |
| Somalis | 62.7 /100 | #163 | Good 65.8% |
| Czechoslovakians | 62.6 /100 | #164 | Good 65.8% |
| Immigrants | Uzbekistan | 61.6 /100 | #165 | Good 65.8% |
| Moroccans | 56.7 /100 | #166 | Average 65.6% |
Demographics Similar to South Americans by College, Under 1 year
In terms of college, under 1 year, the demographic groups most similar to South Americans are French Canadian (64.2%, a difference of 0.010%), Nigerian (64.3%, a difference of 0.040%), Uruguayan (64.2%, a difference of 0.050%), Panamanian (64.3%, a difference of 0.070%), and Tsimshian (64.3%, a difference of 0.13%).
| Demographics | Rating | Rank | College, Under 1 year |
| Immigrants | South Eastern Asia | 22.1 /100 | #195 | Fair 64.5% |
| Tongans | 21.2 /100 | #196 | Fair 64.5% |
| Costa Ricans | 19.6 /100 | #197 | Poor 64.4% |
| Tsimshian | 17.9 /100 | #198 | Poor 64.3% |
| Panamanians | 17.0 /100 | #199 | Poor 64.3% |
| Nigerians | 16.7 /100 | #200 | Poor 64.3% |
| French Canadians | 16.3 /100 | #201 | Poor 64.2% |
| South Americans | 16.2 /100 | #202 | Poor 64.2% |
| Uruguayans | 15.6 /100 | #203 | Poor 64.2% |
| Immigrants | Zaire | 14.6 /100 | #204 | Poor 64.1% |
| Peruvians | 13.7 /100 | #205 | Poor 64.1% |
| Whites/Caucasians | 12.8 /100 | #206 | Poor 64.0% |
| Colombians | 12.4 /100 | #207 | Poor 64.0% |
| Immigrants | Vietnam | 12.1 /100 | #208 | Poor 64.0% |
| Puget Sound Salish | 11.3 /100 | #209 | Poor 63.9% |