Immigrants from Hong Kong vs South American College, Under 1 year
COMPARE
Immigrants from Hong Kong
South American
College, Under 1 year
College, Under 1 year Comparison
Immigrants from Hong Kong
South Americans
71.0%
COLLEGE, UNDER 1 YEAR
100.0/ 100
METRIC RATING
28th/ 347
METRIC RANK
64.2%
COLLEGE, UNDER 1 YEAR
16.2/ 100
METRIC RATING
202nd/ 347
METRIC RANK
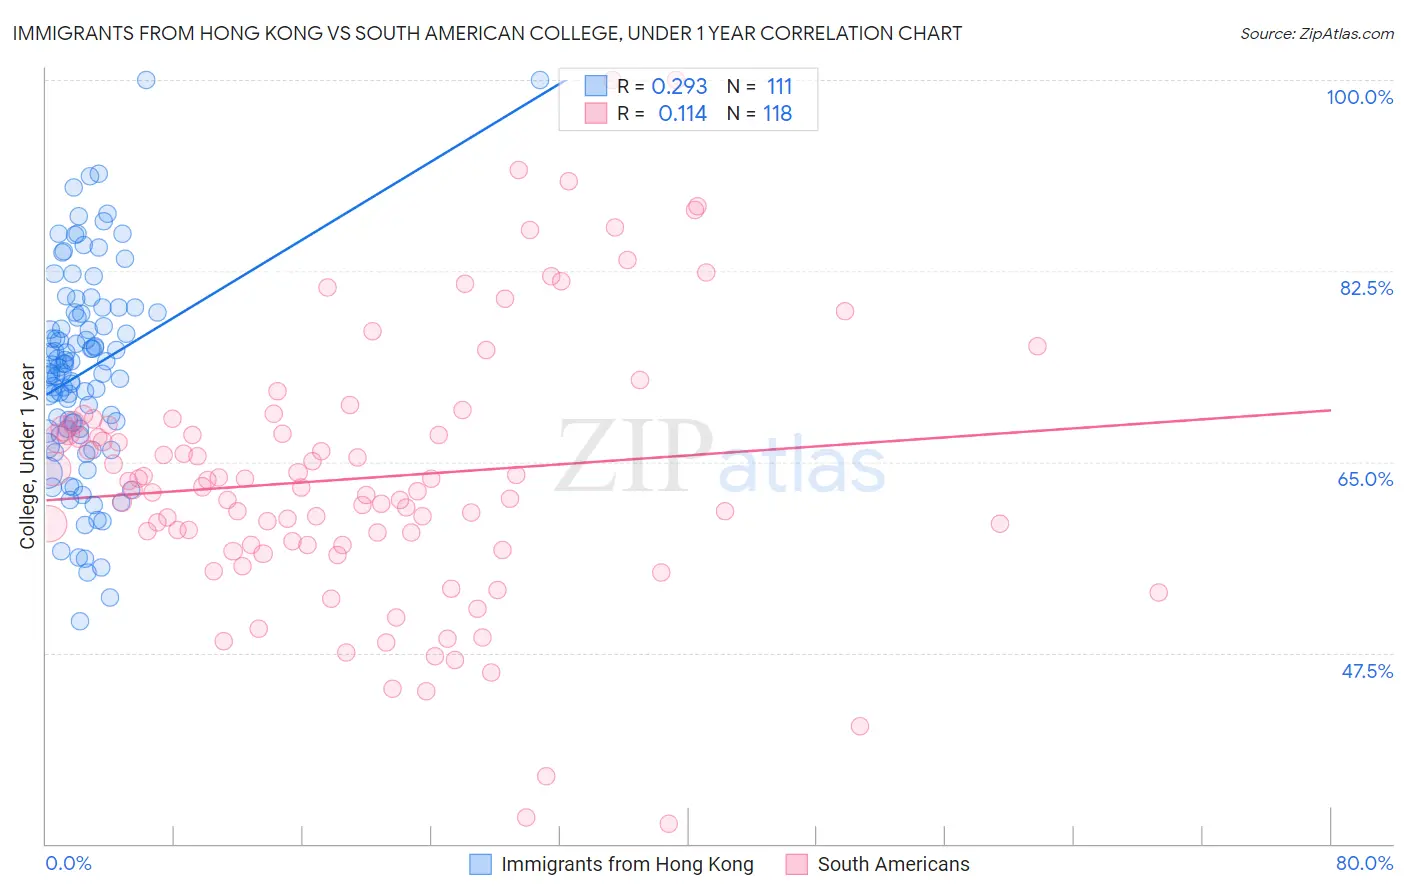
Immigrants from Hong Kong vs South American College, Under 1 year Correlation Chart
The statistical analysis conducted on geographies consisting of 253,990,081 people shows a weak positive correlation between the proportion of Immigrants from Hong Kong and percentage of population with at least college, under 1 year education in the United States with a correlation coefficient (R) of 0.293 and weighted average of 71.0%. Similarly, the statistical analysis conducted on geographies consisting of 494,173,553 people shows a poor positive correlation between the proportion of South Americans and percentage of population with at least college, under 1 year education in the United States with a correlation coefficient (R) of 0.114 and weighted average of 64.2%, a difference of 10.5%.
College, Under 1 year Correlation Summary
| Measurement | Immigrants from Hong Kong | South American |
| Minimum | 50.4% | 31.8% |
| Maximum | 100.0% | 100.0% |
| Range | 49.6% | 68.2% |
| Mean | 73.3% | 63.5% |
| Median | 73.6% | 62.6% |
| Interquartile 25% (IQ1) | 67.8% | 57.4% |
| Interquartile 75% (IQ3) | 78.7% | 68.1% |
| Interquartile Range (IQR) | 10.9% | 10.7% |
| Standard Deviation (Sample) | 9.4% | 12.3% |
| Standard Deviation (Population) | 9.4% | 12.3% |
Similar Demographics by College, Under 1 year
Demographics Similar to Immigrants from Hong Kong by College, Under 1 year
In terms of college, under 1 year, the demographic groups most similar to Immigrants from Hong Kong are Immigrants from France (71.0%, a difference of 0.0%), Immigrants from Denmark (71.0%, a difference of 0.030%), Immigrants from Ireland (71.0%, a difference of 0.030%), Bulgarian (71.1%, a difference of 0.15%), and Soviet Union (71.1%, a difference of 0.17%).
| Demographics | Rating | Rank | College, Under 1 year |
| Immigrants | Belgium | 100.0 /100 | #21 | Exceptional 71.5% |
| Immigrants | Eastern Asia | 100.0 /100 | #22 | Exceptional 71.3% |
| Immigrants | Northern Europe | 100.0 /100 | #23 | Exceptional 71.1% |
| Soviet Union | 100.0 /100 | #24 | Exceptional 71.1% |
| Bulgarians | 100.0 /100 | #25 | Exceptional 71.1% |
| Immigrants | Denmark | 100.0 /100 | #26 | Exceptional 71.0% |
| Immigrants | Ireland | 100.0 /100 | #27 | Exceptional 71.0% |
| Immigrants | Hong Kong | 100.0 /100 | #28 | Exceptional 71.0% |
| Immigrants | France | 100.0 /100 | #29 | Exceptional 71.0% |
| Immigrants | China | 99.9 /100 | #30 | Exceptional 70.9% |
| Indians (Asian) | 99.9 /100 | #31 | Exceptional 70.8% |
| Turks | 99.9 /100 | #32 | Exceptional 70.7% |
| Immigrants | South Africa | 99.9 /100 | #33 | Exceptional 70.6% |
| Estonians | 99.9 /100 | #34 | Exceptional 70.6% |
| Russians | 99.9 /100 | #35 | Exceptional 70.5% |
Demographics Similar to South Americans by College, Under 1 year
In terms of college, under 1 year, the demographic groups most similar to South Americans are French Canadian (64.2%, a difference of 0.010%), Nigerian (64.3%, a difference of 0.040%), Uruguayan (64.2%, a difference of 0.050%), Panamanian (64.3%, a difference of 0.070%), and Tsimshian (64.3%, a difference of 0.13%).
| Demographics | Rating | Rank | College, Under 1 year |
| Immigrants | South Eastern Asia | 22.1 /100 | #195 | Fair 64.5% |
| Tongans | 21.2 /100 | #196 | Fair 64.5% |
| Costa Ricans | 19.6 /100 | #197 | Poor 64.4% |
| Tsimshian | 17.9 /100 | #198 | Poor 64.3% |
| Panamanians | 17.0 /100 | #199 | Poor 64.3% |
| Nigerians | 16.7 /100 | #200 | Poor 64.3% |
| French Canadians | 16.3 /100 | #201 | Poor 64.2% |
| South Americans | 16.2 /100 | #202 | Poor 64.2% |
| Uruguayans | 15.6 /100 | #203 | Poor 64.2% |
| Immigrants | Zaire | 14.6 /100 | #204 | Poor 64.1% |
| Peruvians | 13.7 /100 | #205 | Poor 64.1% |
| Whites/Caucasians | 12.8 /100 | #206 | Poor 64.0% |
| Colombians | 12.4 /100 | #207 | Poor 64.0% |
| Immigrants | Vietnam | 12.1 /100 | #208 | Poor 64.0% |
| Puget Sound Salish | 11.3 /100 | #209 | Poor 63.9% |