Immigrants from Africa vs South American College, Under 1 year
COMPARE
Immigrants from Africa
South American
College, Under 1 year
College, Under 1 year Comparison
Immigrants from Africa
South Americans
65.3%
COLLEGE, UNDER 1 YEAR
44.7/ 100
METRIC RATING
182nd/ 347
METRIC RANK
64.2%
COLLEGE, UNDER 1 YEAR
16.2/ 100
METRIC RATING
202nd/ 347
METRIC RANK
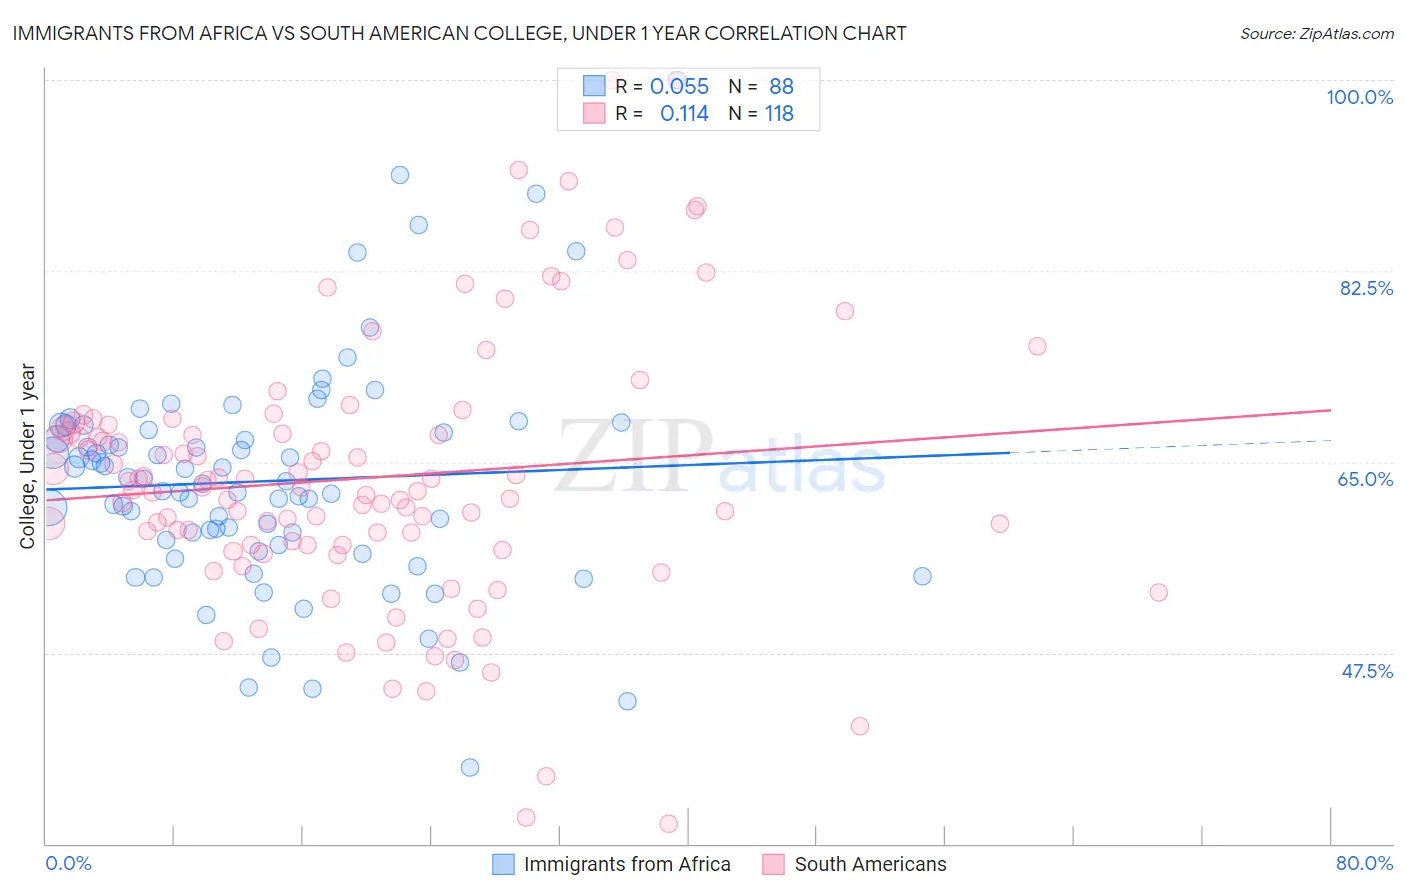
Immigrants from Africa vs South American College, Under 1 year Correlation Chart
The statistical analysis conducted on geographies consisting of 469,444,786 people shows a slight positive correlation between the proportion of Immigrants from Africa and percentage of population with at least college, under 1 year education in the United States with a correlation coefficient (R) of 0.055 and weighted average of 65.3%. Similarly, the statistical analysis conducted on geographies consisting of 494,173,553 people shows a poor positive correlation between the proportion of South Americans and percentage of population with at least college, under 1 year education in the United States with a correlation coefficient (R) of 0.114 and weighted average of 64.2%, a difference of 1.6%.
College, Under 1 year Correlation Summary
| Measurement | Immigrants from Africa | South American |
| Minimum | 37.0% | 31.8% |
| Maximum | 100.0% | 100.0% |
| Range | 63.0% | 68.2% |
| Mean | 63.2% | 63.5% |
| Median | 63.1% | 62.6% |
| Interquartile 25% (IQ1) | 57.7% | 57.4% |
| Interquartile 75% (IQ3) | 67.9% | 68.1% |
| Interquartile Range (IQR) | 10.2% | 10.7% |
| Standard Deviation (Sample) | 10.4% | 12.3% |
| Standard Deviation (Population) | 10.3% | 12.3% |
Demographics Similar to Immigrants from Africa and South Americans by College, Under 1 year
In terms of college, under 1 year, the demographic groups most similar to Immigrants from Africa are Immigrants from Poland (65.2%, a difference of 0.10%), Bermudan (65.2%, a difference of 0.12%), Sri Lankan (65.2%, a difference of 0.13%), Immigrants from Sierra Leone (65.1%, a difference of 0.23%), and Immigrants from Southern Europe (64.9%, a difference of 0.49%). Similarly, the demographic groups most similar to South Americans are French Canadian (64.2%, a difference of 0.010%), Nigerian (64.3%, a difference of 0.040%), Panamanian (64.3%, a difference of 0.070%), Tsimshian (64.3%, a difference of 0.13%), and Costa Rican (64.4%, a difference of 0.26%).
| Demographics | Rating | Rank | College, Under 1 year |
| Immigrants | Africa | 44.7 /100 | #182 | Average 65.3% |
| Immigrants | Poland | 42.6 /100 | #183 | Average 65.2% |
| Bermudans | 42.0 /100 | #184 | Average 65.2% |
| Sri Lankans | 41.7 /100 | #185 | Average 65.2% |
| Immigrants | Sierra Leone | 39.7 /100 | #186 | Fair 65.1% |
| Immigrants | Southern Europe | 34.3 /100 | #187 | Fair 64.9% |
| Immigrants | Albania | 32.0 /100 | #188 | Fair 64.9% |
| Spanish | 31.6 /100 | #189 | Fair 64.9% |
| Immigrants | Philippines | 30.1 /100 | #190 | Fair 64.8% |
| Immigrants | Armenia | 28.1 /100 | #191 | Fair 64.7% |
| Immigrants | Thailand | 27.0 /100 | #192 | Fair 64.7% |
| Slovaks | 26.7 /100 | #193 | Fair 64.7% |
| Immigrants | Cameroon | 24.6 /100 | #194 | Fair 64.6% |
| Immigrants | South Eastern Asia | 22.1 /100 | #195 | Fair 64.5% |
| Tongans | 21.2 /100 | #196 | Fair 64.5% |
| Costa Ricans | 19.6 /100 | #197 | Poor 64.4% |
| Tsimshian | 17.9 /100 | #198 | Poor 64.3% |
| Panamanians | 17.0 /100 | #199 | Poor 64.3% |
| Nigerians | 16.7 /100 | #200 | Poor 64.3% |
| French Canadians | 16.3 /100 | #201 | Poor 64.2% |
| South Americans | 16.2 /100 | #202 | Poor 64.2% |