Immigrants from Canada vs Lumbee GED/Equivalency
COMPARE
Immigrants from Canada
Lumbee
GED/Equivalency
GED/Equivalency Comparison
Immigrants from Canada
Lumbee
87.9%
GED/EQUIVALENCY
99.2/ 100
METRIC RATING
64th/ 347
METRIC RANK
80.0%
GED/EQUIVALENCY
0.0/ 100
METRIC RATING
322nd/ 347
METRIC RANK
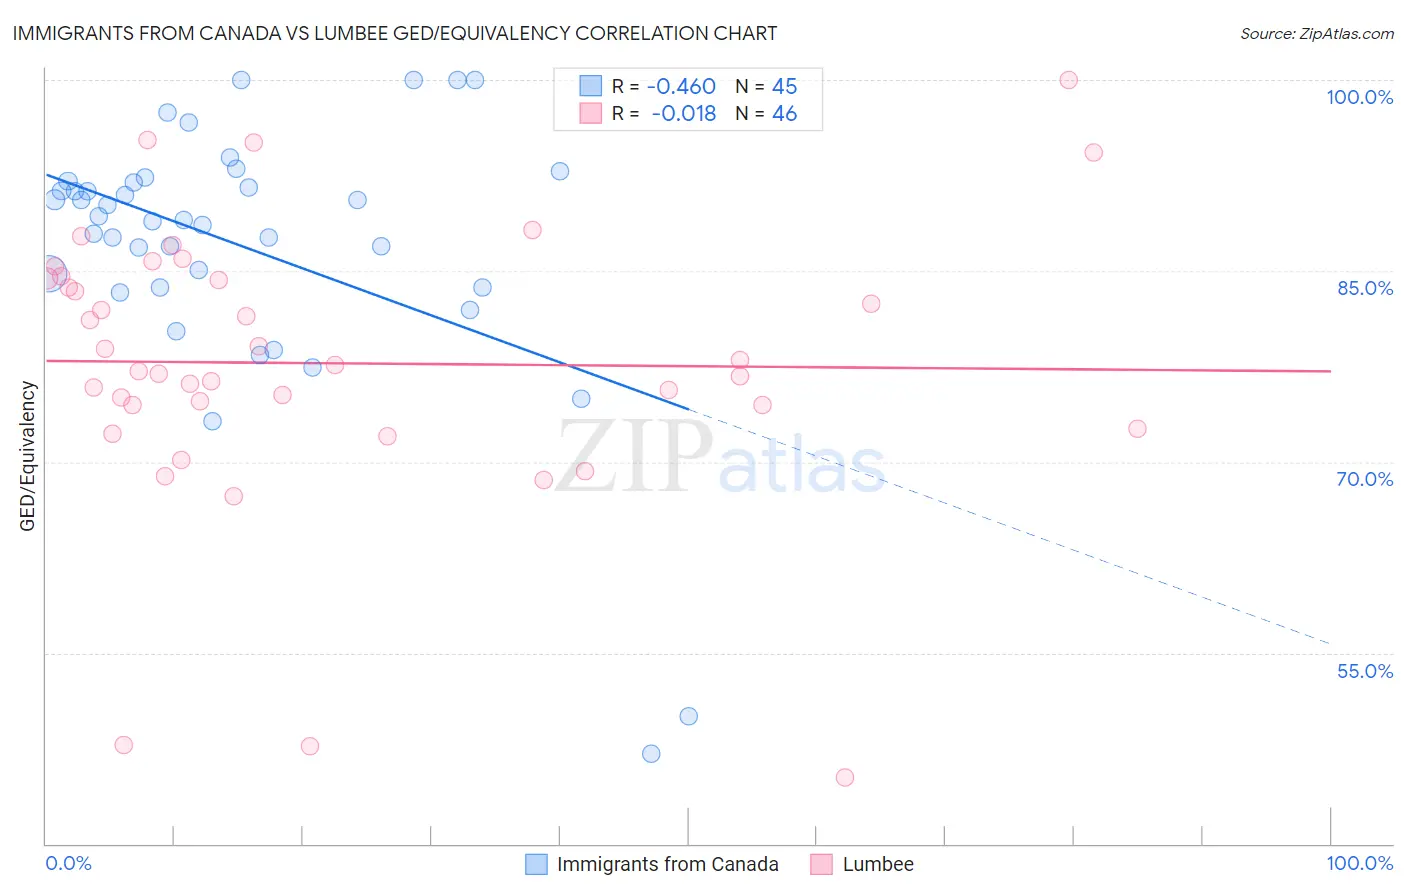
Immigrants from Canada vs Lumbee GED/Equivalency Correlation Chart
The statistical analysis conducted on geographies consisting of 459,397,064 people shows a moderate negative correlation between the proportion of Immigrants from Canada and percentage of population with at least ged/equivalency education in the United States with a correlation coefficient (R) of -0.460 and weighted average of 87.9%. Similarly, the statistical analysis conducted on geographies consisting of 92,299,068 people shows no correlation between the proportion of Lumbee and percentage of population with at least ged/equivalency education in the United States with a correlation coefficient (R) of -0.018 and weighted average of 80.0%, a difference of 9.9%.
GED/Equivalency Correlation Summary
| Measurement | Immigrants from Canada | Lumbee |
| Minimum | 47.1% | 45.2% |
| Maximum | 100.0% | 100.0% |
| Range | 52.9% | 54.8% |
| Mean | 86.9% | 77.7% |
| Median | 89.0% | 77.4% |
| Interquartile 25% (IQ1) | 83.7% | 74.5% |
| Interquartile 75% (IQ3) | 92.0% | 84.4% |
| Interquartile Range (IQR) | 8.3% | 10.0% |
| Standard Deviation (Sample) | 10.5% | 11.1% |
| Standard Deviation (Population) | 10.4% | 11.0% |
Similar Demographics by GED/Equivalency
Demographics Similar to Immigrants from Canada by GED/Equivalency
In terms of ged/equivalency, the demographic groups most similar to Immigrants from Canada are Immigrants from North America (87.8%, a difference of 0.030%), Immigrants from Bulgaria (87.8%, a difference of 0.030%), Immigrants from Turkey (87.9%, a difference of 0.040%), German (87.9%, a difference of 0.050%), and British (87.8%, a difference of 0.050%).
| Demographics | Rating | Rank | GED/Equivalency |
| Immigrants | Czechoslovakia | 99.3 /100 | #57 | Exceptional 87.9% |
| Northern Europeans | 99.3 /100 | #58 | Exceptional 87.9% |
| Serbians | 99.3 /100 | #59 | Exceptional 87.9% |
| Scandinavians | 99.3 /100 | #60 | Exceptional 87.9% |
| Europeans | 99.3 /100 | #61 | Exceptional 87.9% |
| Germans | 99.3 /100 | #62 | Exceptional 87.9% |
| Immigrants | Turkey | 99.2 /100 | #63 | Exceptional 87.9% |
| Immigrants | Canada | 99.2 /100 | #64 | Exceptional 87.9% |
| Immigrants | North America | 99.1 /100 | #65 | Exceptional 87.8% |
| Immigrants | Bulgaria | 99.1 /100 | #66 | Exceptional 87.8% |
| British | 99.1 /100 | #67 | Exceptional 87.8% |
| Immigrants | France | 99.1 /100 | #68 | Exceptional 87.8% |
| Immigrants | Saudi Arabia | 99.0 /100 | #69 | Exceptional 87.8% |
| Ukrainians | 98.8 /100 | #70 | Exceptional 87.7% |
| Austrians | 98.8 /100 | #71 | Exceptional 87.7% |
Demographics Similar to Lumbee by GED/Equivalency
In terms of ged/equivalency, the demographic groups most similar to Lumbee are Yup'ik (80.0%, a difference of 0.070%), Immigrants from Nicaragua (79.9%, a difference of 0.12%), Immigrants from Cuba (80.2%, a difference of 0.24%), Yaqui (80.5%, a difference of 0.65%), and Immigrants from Belize (80.5%, a difference of 0.65%).
| Demographics | Rating | Rank | GED/Equivalency |
| Apache | 0.0 /100 | #315 | Tragic 80.7% |
| Central American Indians | 0.0 /100 | #316 | Tragic 80.6% |
| Immigrants | Caribbean | 0.0 /100 | #317 | Tragic 80.5% |
| Yaqui | 0.0 /100 | #318 | Tragic 80.5% |
| Immigrants | Belize | 0.0 /100 | #319 | Tragic 80.5% |
| Immigrants | Cuba | 0.0 /100 | #320 | Tragic 80.2% |
| Yup'ik | 0.0 /100 | #321 | Tragic 80.0% |
| Lumbee | 0.0 /100 | #322 | Tragic 80.0% |
| Immigrants | Nicaragua | 0.0 /100 | #323 | Tragic 79.9% |
| Mexican American Indians | 0.0 /100 | #324 | Tragic 79.4% |
| Hondurans | 0.0 /100 | #325 | Tragic 79.3% |
| Yuman | 0.0 /100 | #326 | Tragic 79.2% |
| Central Americans | 0.0 /100 | #327 | Tragic 79.2% |
| Hispanics or Latinos | 0.0 /100 | #328 | Tragic 79.1% |
| Dominicans | 0.0 /100 | #329 | Tragic 79.1% |