Immigrants from Congo vs Lumbee GED/Equivalency
COMPARE
Immigrants from Congo
Lumbee
GED/Equivalency
GED/Equivalency Comparison
Immigrants from Congo
Lumbee
83.1%
GED/EQUIVALENCY
0.2/ 100
METRIC RATING
263rd/ 347
METRIC RANK
80.0%
GED/EQUIVALENCY
0.0/ 100
METRIC RATING
322nd/ 347
METRIC RANK
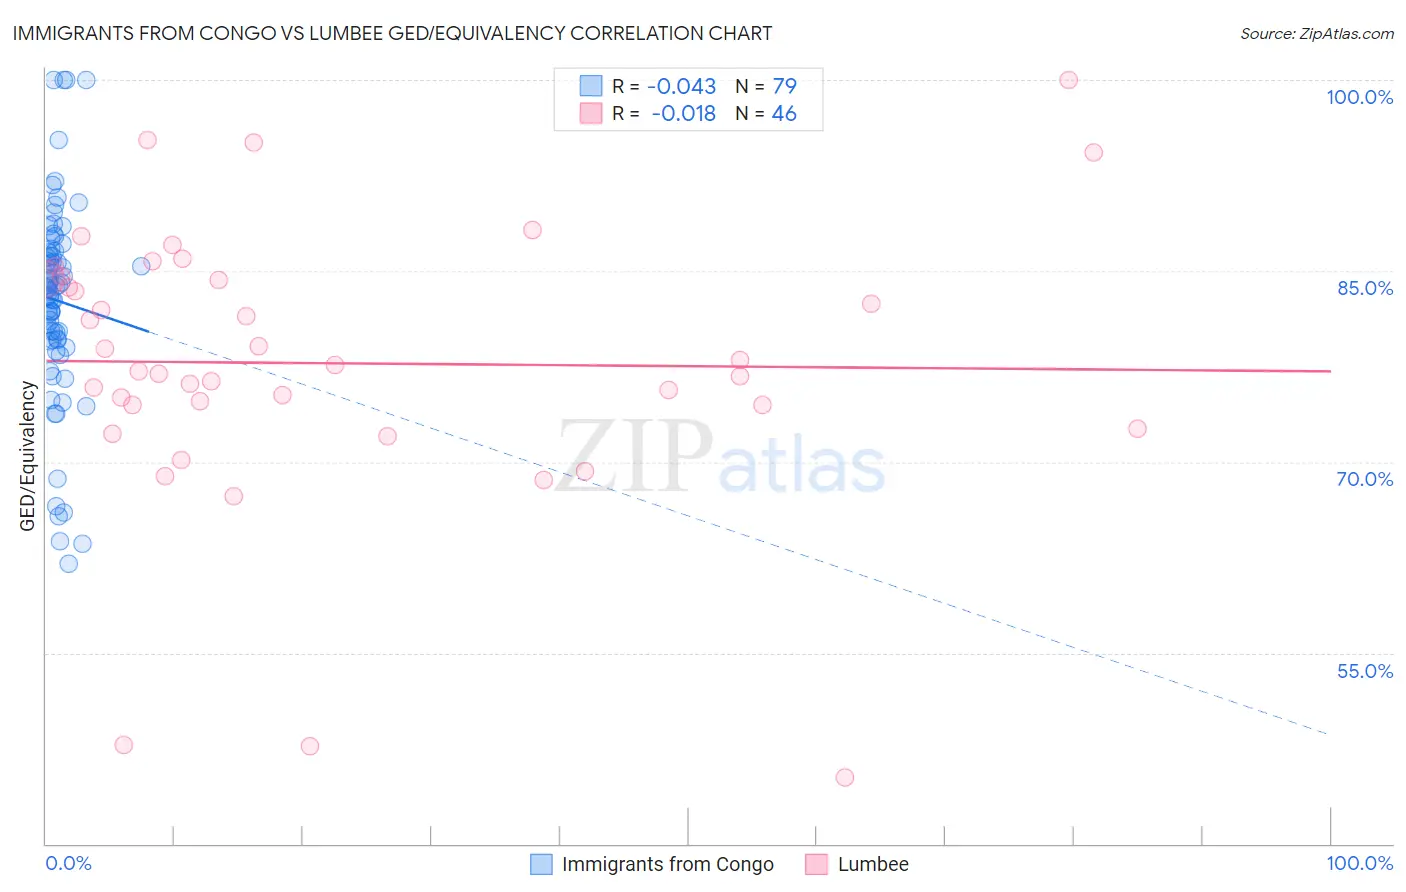
Immigrants from Congo vs Lumbee GED/Equivalency Correlation Chart
The statistical analysis conducted on geographies consisting of 92,095,910 people shows no correlation between the proportion of Immigrants from Congo and percentage of population with at least ged/equivalency education in the United States with a correlation coefficient (R) of -0.043 and weighted average of 83.1%. Similarly, the statistical analysis conducted on geographies consisting of 92,299,068 people shows no correlation between the proportion of Lumbee and percentage of population with at least ged/equivalency education in the United States with a correlation coefficient (R) of -0.018 and weighted average of 80.0%, a difference of 3.9%.
GED/Equivalency Correlation Summary
| Measurement | Immigrants from Congo | Lumbee |
| Minimum | 62.0% | 45.2% |
| Maximum | 100.0% | 100.0% |
| Range | 38.0% | 54.8% |
| Mean | 82.7% | 77.7% |
| Median | 83.7% | 77.4% |
| Interquartile 25% (IQ1) | 79.5% | 74.5% |
| Interquartile 75% (IQ3) | 86.5% | 84.4% |
| Interquartile Range (IQR) | 7.0% | 10.0% |
| Standard Deviation (Sample) | 7.9% | 11.1% |
| Standard Deviation (Population) | 7.8% | 11.0% |
Similar Demographics by GED/Equivalency
Demographics Similar to Immigrants from Congo by GED/Equivalency
In terms of ged/equivalency, the demographic groups most similar to Immigrants from Congo are Inupiat (83.1%, a difference of 0.010%), Immigrants from Armenia (83.1%, a difference of 0.010%), Bangladeshi (83.1%, a difference of 0.010%), West Indian (83.1%, a difference of 0.020%), and Kiowa (83.1%, a difference of 0.030%).
| Demographics | Rating | Rank | GED/Equivalency |
| Africans | 0.5 /100 | #256 | Tragic 83.4% |
| Jamaicans | 0.4 /100 | #257 | Tragic 83.3% |
| Malaysians | 0.4 /100 | #258 | Tragic 83.3% |
| Immigrants | Vietnam | 0.3 /100 | #259 | Tragic 83.2% |
| Choctaw | 0.3 /100 | #260 | Tragic 83.1% |
| Inupiat | 0.2 /100 | #261 | Tragic 83.1% |
| Immigrants | Armenia | 0.2 /100 | #262 | Tragic 83.1% |
| Immigrants | Congo | 0.2 /100 | #263 | Tragic 83.1% |
| Bangladeshis | 0.2 /100 | #264 | Tragic 83.1% |
| West Indians | 0.2 /100 | #265 | Tragic 83.1% |
| Kiowa | 0.2 /100 | #266 | Tragic 83.1% |
| Trinidadians and Tobagonians | 0.2 /100 | #267 | Tragic 83.0% |
| Immigrants | Burma/Myanmar | 0.2 /100 | #268 | Tragic 83.0% |
| Hopi | 0.2 /100 | #269 | Tragic 83.0% |
| Immigrants | Jamaica | 0.2 /100 | #270 | Tragic 82.9% |
Demographics Similar to Lumbee by GED/Equivalency
In terms of ged/equivalency, the demographic groups most similar to Lumbee are Yup'ik (80.0%, a difference of 0.070%), Immigrants from Nicaragua (79.9%, a difference of 0.12%), Immigrants from Cuba (80.2%, a difference of 0.24%), Yaqui (80.5%, a difference of 0.65%), and Immigrants from Belize (80.5%, a difference of 0.65%).
| Demographics | Rating | Rank | GED/Equivalency |
| Apache | 0.0 /100 | #315 | Tragic 80.7% |
| Central American Indians | 0.0 /100 | #316 | Tragic 80.6% |
| Immigrants | Caribbean | 0.0 /100 | #317 | Tragic 80.5% |
| Yaqui | 0.0 /100 | #318 | Tragic 80.5% |
| Immigrants | Belize | 0.0 /100 | #319 | Tragic 80.5% |
| Immigrants | Cuba | 0.0 /100 | #320 | Tragic 80.2% |
| Yup'ik | 0.0 /100 | #321 | Tragic 80.0% |
| Lumbee | 0.0 /100 | #322 | Tragic 80.0% |
| Immigrants | Nicaragua | 0.0 /100 | #323 | Tragic 79.9% |
| Mexican American Indians | 0.0 /100 | #324 | Tragic 79.4% |
| Hondurans | 0.0 /100 | #325 | Tragic 79.3% |
| Yuman | 0.0 /100 | #326 | Tragic 79.2% |
| Central Americans | 0.0 /100 | #327 | Tragic 79.2% |
| Hispanics or Latinos | 0.0 /100 | #328 | Tragic 79.1% |
| Dominicans | 0.0 /100 | #329 | Tragic 79.1% |