Immigrants from Japan vs Lumbee Professional Degree
COMPARE
Immigrants from Japan
Lumbee
Professional Degree
Professional Degree Comparison
Immigrants from Japan
Lumbee
6.4%
PROFESSIONAL DEGREE
100.0/ 100
METRIC RATING
22nd/ 347
METRIC RANK
2.5%
PROFESSIONAL DEGREE
0.0/ 100
METRIC RATING
346th/ 347
METRIC RANK
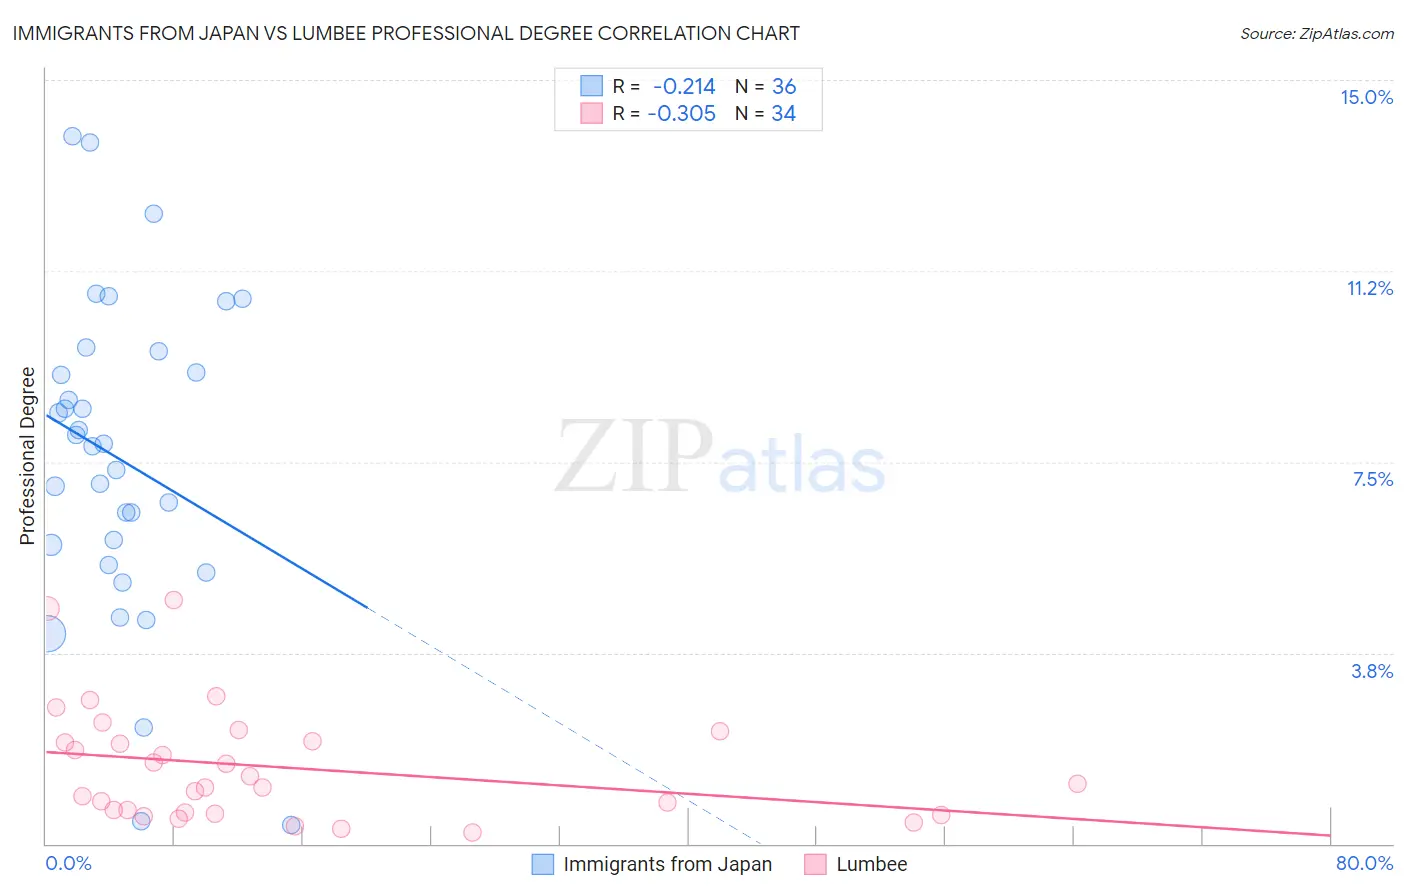
Immigrants from Japan vs Lumbee Professional Degree Correlation Chart
The statistical analysis conducted on geographies consisting of 339,733,444 people shows a weak negative correlation between the proportion of Immigrants from Japan and percentage of population with at least professional degree education in the United States with a correlation coefficient (R) of -0.214 and weighted average of 6.4%. Similarly, the statistical analysis conducted on geographies consisting of 92,157,121 people shows a mild negative correlation between the proportion of Lumbee and percentage of population with at least professional degree education in the United States with a correlation coefficient (R) of -0.305 and weighted average of 2.5%, a difference of 158.4%.
Professional Degree Correlation Summary
| Measurement | Immigrants from Japan | Lumbee |
| Minimum | 0.36% | 0.22% |
| Maximum | 13.9% | 4.8% |
| Range | 13.5% | 4.6% |
| Mean | 7.6% | 1.5% |
| Median | 7.8% | 1.1% |
| Interquartile 25% (IQ1) | 5.7% | 0.60% |
| Interquartile 75% (IQ3) | 9.5% | 2.0% |
| Interquartile Range (IQR) | 3.8% | 1.4% |
| Standard Deviation (Sample) | 3.2% | 1.1% |
| Standard Deviation (Population) | 3.1% | 1.1% |
Similar Demographics by Professional Degree
Demographics Similar to Immigrants from Japan by Professional Degree
In terms of professional degree, the demographic groups most similar to Immigrants from Japan are Russian (6.3%, a difference of 0.48%), Immigrants from Spain (6.3%, a difference of 0.51%), Immigrants from Hong Kong (6.4%, a difference of 0.73%), Immigrants from Denmark (6.4%, a difference of 0.95%), and Immigrants from Ireland (6.3%, a difference of 1.0%).
| Demographics | Rating | Rank | Professional Degree |
| Immigrants | China | 100.0 /100 | #15 | Exceptional 6.7% |
| Immigrants | Sweden | 100.0 /100 | #16 | Exceptional 6.7% |
| Immigrants | Eastern Asia | 100.0 /100 | #17 | Exceptional 6.6% |
| Soviet Union | 100.0 /100 | #18 | Exceptional 6.6% |
| Indians (Asian) | 100.0 /100 | #19 | Exceptional 6.5% |
| Immigrants | Denmark | 100.0 /100 | #20 | Exceptional 6.4% |
| Immigrants | Hong Kong | 100.0 /100 | #21 | Exceptional 6.4% |
| Immigrants | Japan | 100.0 /100 | #22 | Exceptional 6.4% |
| Russians | 100.0 /100 | #23 | Exceptional 6.3% |
| Immigrants | Spain | 100.0 /100 | #24 | Exceptional 6.3% |
| Immigrants | Ireland | 100.0 /100 | #25 | Exceptional 6.3% |
| Latvians | 100.0 /100 | #26 | Exceptional 6.2% |
| Immigrants | Northern Europe | 100.0 /100 | #27 | Exceptional 6.2% |
| Turks | 100.0 /100 | #28 | Exceptional 6.2% |
| Immigrants | Sri Lanka | 100.0 /100 | #29 | Exceptional 6.2% |
Demographics Similar to Lumbee by Professional Degree
In terms of professional degree, the demographic groups most similar to Lumbee are Immigrants from Mexico (2.6%, a difference of 7.4%), Spanish American Indian (2.7%, a difference of 7.7%), Houma (2.2%, a difference of 11.1%), Mexican (2.7%, a difference of 11.7%), and Immigrants from the Azores (2.8%, a difference of 14.8%).
| Demographics | Rating | Rank | Professional Degree |
| Puget Sound Salish | 0.0 /100 | #333 | Tragic 3.1% |
| Pennsylvania Germans | 0.0 /100 | #334 | Tragic 3.0% |
| Natives/Alaskans | 0.0 /100 | #335 | Tragic 3.0% |
| Fijians | 0.0 /100 | #336 | Tragic 2.9% |
| Arapaho | 0.0 /100 | #337 | Tragic 2.9% |
| Navajo | 0.0 /100 | #338 | Tragic 2.9% |
| Immigrants | Central America | 0.0 /100 | #339 | Tragic 2.9% |
| Yup'ik | 0.0 /100 | #340 | Tragic 2.9% |
| Tohono O'odham | 0.0 /100 | #341 | Tragic 2.8% |
| Immigrants | Azores | 0.0 /100 | #342 | Tragic 2.8% |
| Mexicans | 0.0 /100 | #343 | Tragic 2.7% |
| Spanish American Indians | 0.0 /100 | #344 | Tragic 2.7% |
| Immigrants | Mexico | 0.0 /100 | #345 | Tragic 2.6% |
| Lumbee | 0.0 /100 | #346 | Tragic 2.5% |
| Houma | 0.0 /100 | #347 | Tragic 2.2% |