Immigrants from Jamaica vs Immigrants from Haiti College, Under 1 year
COMPARE
Immigrants from Jamaica
Immigrants from Haiti
College, Under 1 year
College, Under 1 year Comparison
Immigrants from Jamaica
Immigrants from Haiti
59.7%
COLLEGE, UNDER 1 YEAR
0.0/ 100
METRIC RATING
283rd/ 347
METRIC RANK
56.9%
COLLEGE, UNDER 1 YEAR
0.0/ 100
METRIC RATING
318th/ 347
METRIC RANK
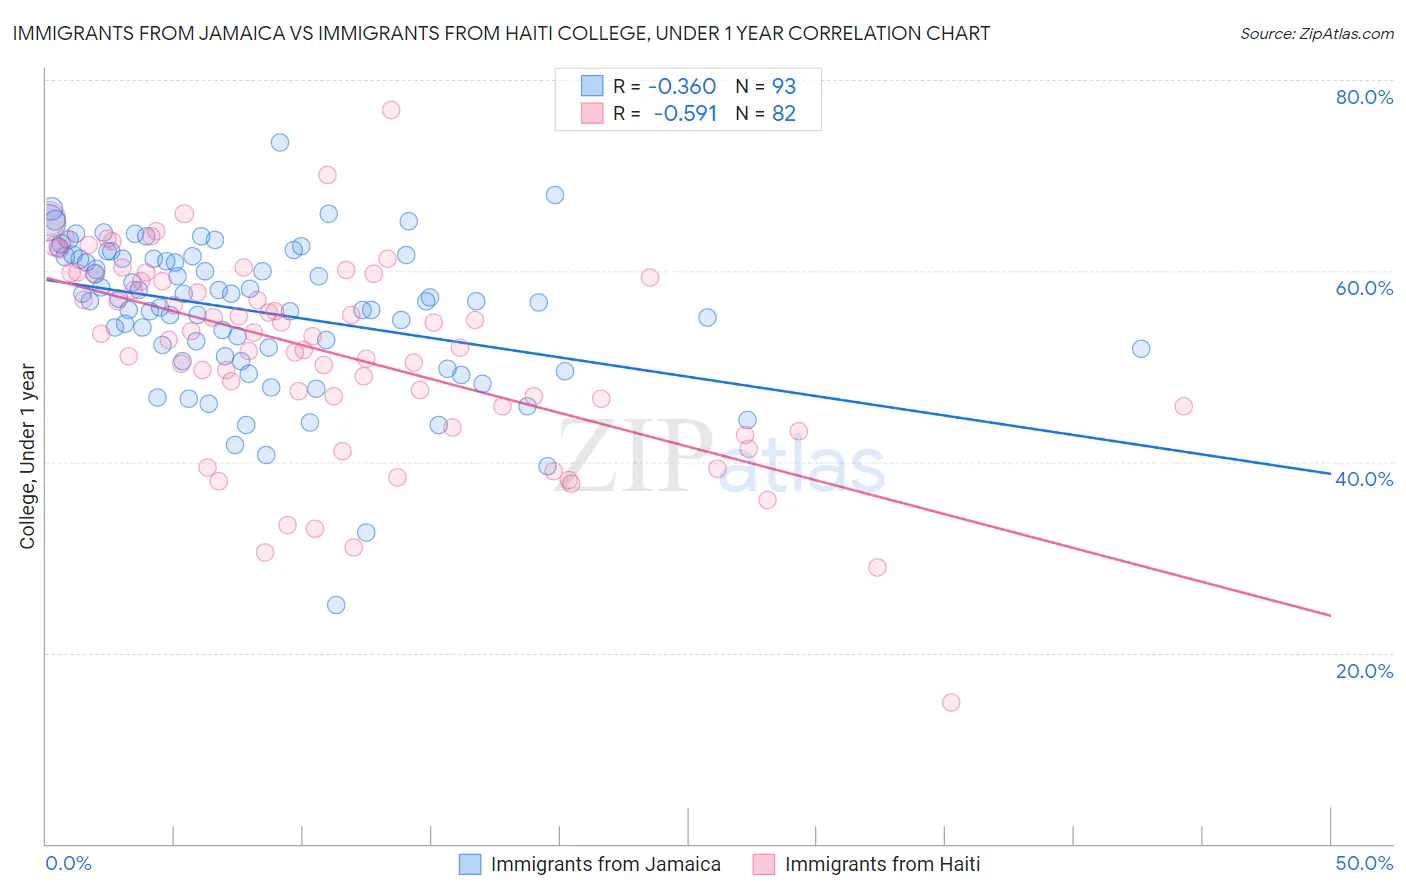
Immigrants from Jamaica vs Immigrants from Haiti College, Under 1 year Correlation Chart
The statistical analysis conducted on geographies consisting of 301,826,603 people shows a mild negative correlation between the proportion of Immigrants from Jamaica and percentage of population with at least college, under 1 year education in the United States with a correlation coefficient (R) of -0.360 and weighted average of 59.7%. Similarly, the statistical analysis conducted on geographies consisting of 225,287,293 people shows a substantial negative correlation between the proportion of Immigrants from Haiti and percentage of population with at least college, under 1 year education in the United States with a correlation coefficient (R) of -0.591 and weighted average of 56.9%, a difference of 4.8%.
College, Under 1 year Correlation Summary
| Measurement | Immigrants from Jamaica | Immigrants from Haiti |
| Minimum | 24.9% | 14.8% |
| Maximum | 73.4% | 76.9% |
| Range | 48.5% | 62.1% |
| Mean | 55.8% | 51.5% |
| Median | 56.8% | 53.3% |
| Interquartile 25% (IQ1) | 51.5% | 45.9% |
| Interquartile 75% (IQ3) | 61.5% | 59.7% |
| Interquartile Range (IQR) | 10.0% | 13.8% |
| Standard Deviation (Sample) | 7.9% | 10.6% |
| Standard Deviation (Population) | 7.8% | 10.5% |
Similar Demographics by College, Under 1 year
Demographics Similar to Immigrants from Jamaica by College, Under 1 year
In terms of college, under 1 year, the demographic groups most similar to Immigrants from Jamaica are Immigrants from St. Vincent and the Grenadines (59.6%, a difference of 0.11%), Paiute (59.6%, a difference of 0.12%), British West Indian (59.5%, a difference of 0.27%), Sioux (59.4%, a difference of 0.44%), and Black/African American (59.4%, a difference of 0.54%).
| Demographics | Rating | Rank | College, Under 1 year |
| Arapaho | 0.1 /100 | #276 | Tragic 60.3% |
| Bahamians | 0.1 /100 | #277 | Tragic 60.3% |
| Yaqui | 0.1 /100 | #278 | Tragic 60.2% |
| Ute | 0.1 /100 | #279 | Tragic 60.2% |
| Crow | 0.1 /100 | #280 | Tragic 60.2% |
| Cherokee | 0.1 /100 | #281 | Tragic 60.1% |
| Belizeans | 0.1 /100 | #282 | Tragic 60.1% |
| Immigrants | Jamaica | 0.0 /100 | #283 | Tragic 59.7% |
| Immigrants | St. Vincent and the Grenadines | 0.0 /100 | #284 | Tragic 59.6% |
| Paiute | 0.0 /100 | #285 | Tragic 59.6% |
| British West Indians | 0.0 /100 | #286 | Tragic 59.5% |
| Sioux | 0.0 /100 | #287 | Tragic 59.4% |
| Blacks/African Americans | 0.0 /100 | #288 | Tragic 59.4% |
| Choctaw | 0.0 /100 | #289 | Tragic 59.3% |
| Ecuadorians | 0.0 /100 | #290 | Tragic 59.3% |
Demographics Similar to Immigrants from Haiti by College, Under 1 year
In terms of college, under 1 year, the demographic groups most similar to Immigrants from Haiti are Hispanic or Latino (57.0%, a difference of 0.12%), Menominee (57.0%, a difference of 0.16%), Puerto Rican (56.8%, a difference of 0.20%), Honduran (57.1%, a difference of 0.21%), and Hopi (57.1%, a difference of 0.25%).
| Demographics | Rating | Rank | College, Under 1 year |
| Cajuns | 0.0 /100 | #311 | Tragic 57.3% |
| Salvadorans | 0.0 /100 | #312 | Tragic 57.3% |
| Dutch West Indians | 0.0 /100 | #313 | Tragic 57.2% |
| Hopi | 0.0 /100 | #314 | Tragic 57.1% |
| Hondurans | 0.0 /100 | #315 | Tragic 57.1% |
| Menominee | 0.0 /100 | #316 | Tragic 57.0% |
| Hispanics or Latinos | 0.0 /100 | #317 | Tragic 57.0% |
| Immigrants | Haiti | 0.0 /100 | #318 | Tragic 56.9% |
| Puerto Ricans | 0.0 /100 | #319 | Tragic 56.8% |
| Guatemalans | 0.0 /100 | #320 | Tragic 56.8% |
| Natives/Alaskans | 0.0 /100 | #321 | Tragic 56.6% |
| Immigrants | Caribbean | 0.0 /100 | #322 | Tragic 56.6% |
| Immigrants | Honduras | 0.0 /100 | #323 | Tragic 56.5% |
| Immigrants | El Salvador | 0.0 /100 | #324 | Tragic 56.4% |
| Immigrants | Latin America | 0.0 /100 | #325 | Tragic 56.3% |