Immigrants from Jamaica vs Japanese College, Under 1 year
COMPARE
Immigrants from Jamaica
Japanese
College, Under 1 year
College, Under 1 year Comparison
Immigrants from Jamaica
Japanese
59.7%
COLLEGE, UNDER 1 YEAR
0.0/ 100
METRIC RATING
283rd/ 347
METRIC RANK
61.5%
COLLEGE, UNDER 1 YEAR
0.4/ 100
METRIC RATING
253rd/ 347
METRIC RANK
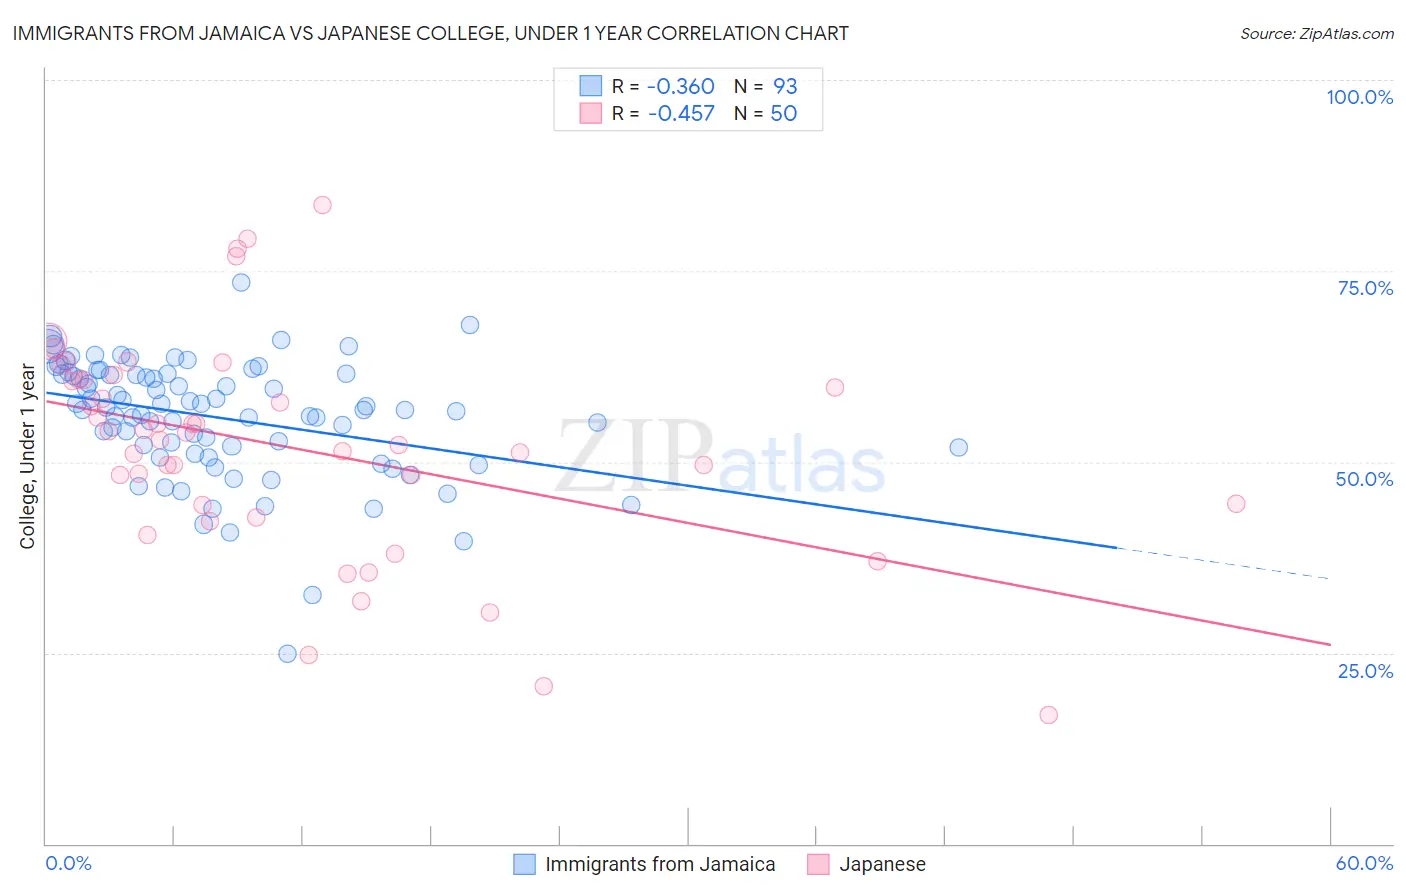
Immigrants from Jamaica vs Japanese College, Under 1 year Correlation Chart
The statistical analysis conducted on geographies consisting of 301,826,603 people shows a mild negative correlation between the proportion of Immigrants from Jamaica and percentage of population with at least college, under 1 year education in the United States with a correlation coefficient (R) of -0.360 and weighted average of 59.7%. Similarly, the statistical analysis conducted on geographies consisting of 249,181,552 people shows a moderate negative correlation between the proportion of Japanese and percentage of population with at least college, under 1 year education in the United States with a correlation coefficient (R) of -0.457 and weighted average of 61.5%, a difference of 3.0%.
College, Under 1 year Correlation Summary
| Measurement | Immigrants from Jamaica | Japanese |
| Minimum | 24.9% | 16.8% |
| Maximum | 73.4% | 83.7% |
| Range | 48.5% | 66.8% |
| Mean | 55.8% | 51.9% |
| Median | 56.8% | 53.4% |
| Interquartile 25% (IQ1) | 51.5% | 44.3% |
| Interquartile 75% (IQ3) | 61.5% | 60.8% |
| Interquartile Range (IQR) | 10.0% | 16.5% |
| Standard Deviation (Sample) | 7.9% | 14.1% |
| Standard Deviation (Population) | 7.8% | 13.9% |
Similar Demographics by College, Under 1 year
Demographics Similar to Immigrants from Jamaica by College, Under 1 year
In terms of college, under 1 year, the demographic groups most similar to Immigrants from Jamaica are Immigrants from St. Vincent and the Grenadines (59.6%, a difference of 0.11%), Paiute (59.6%, a difference of 0.12%), British West Indian (59.5%, a difference of 0.27%), Sioux (59.4%, a difference of 0.44%), and Black/African American (59.4%, a difference of 0.54%).
| Demographics | Rating | Rank | College, Under 1 year |
| Arapaho | 0.1 /100 | #276 | Tragic 60.3% |
| Bahamians | 0.1 /100 | #277 | Tragic 60.3% |
| Yaqui | 0.1 /100 | #278 | Tragic 60.2% |
| Ute | 0.1 /100 | #279 | Tragic 60.2% |
| Crow | 0.1 /100 | #280 | Tragic 60.2% |
| Cherokee | 0.1 /100 | #281 | Tragic 60.1% |
| Belizeans | 0.1 /100 | #282 | Tragic 60.1% |
| Immigrants | Jamaica | 0.0 /100 | #283 | Tragic 59.7% |
| Immigrants | St. Vincent and the Grenadines | 0.0 /100 | #284 | Tragic 59.6% |
| Paiute | 0.0 /100 | #285 | Tragic 59.6% |
| British West Indians | 0.0 /100 | #286 | Tragic 59.5% |
| Sioux | 0.0 /100 | #287 | Tragic 59.4% |
| Blacks/African Americans | 0.0 /100 | #288 | Tragic 59.4% |
| Choctaw | 0.0 /100 | #289 | Tragic 59.3% |
| Ecuadorians | 0.0 /100 | #290 | Tragic 59.3% |
Demographics Similar to Japanese by College, Under 1 year
In terms of college, under 1 year, the demographic groups most similar to Japanese are West Indian (61.5%, a difference of 0.0%), Immigrants from Cambodia (61.5%, a difference of 0.0%), Immigrants from Micronesia (61.5%, a difference of 0.11%), Comanche (61.4%, a difference of 0.13%), and Bangladeshi (61.4%, a difference of 0.17%).
| Demographics | Rating | Rank | College, Under 1 year |
| Marshallese | 0.8 /100 | #246 | Tragic 61.9% |
| Immigrants | Liberia | 0.8 /100 | #247 | Tragic 61.9% |
| Potawatomi | 0.6 /100 | #248 | Tragic 61.8% |
| Vietnamese | 0.5 /100 | #249 | Tragic 61.7% |
| Immigrants | Congo | 0.5 /100 | #250 | Tragic 61.7% |
| Immigrants | Micronesia | 0.5 /100 | #251 | Tragic 61.5% |
| West Indians | 0.4 /100 | #252 | Tragic 61.5% |
| Japanese | 0.4 /100 | #253 | Tragic 61.5% |
| Immigrants | Cambodia | 0.4 /100 | #254 | Tragic 61.5% |
| Comanche | 0.4 /100 | #255 | Tragic 61.4% |
| Bangladeshis | 0.4 /100 | #256 | Tragic 61.4% |
| Immigrants | Laos | 0.3 /100 | #257 | Tragic 61.3% |
| Immigrants | Bangladesh | 0.3 /100 | #258 | Tragic 61.3% |
| Indonesians | 0.3 /100 | #259 | Tragic 61.2% |
| Blackfeet | 0.3 /100 | #260 | Tragic 61.1% |