Immigrants from Jamaica vs Immigrants from Poland College, Under 1 year
COMPARE
Immigrants from Jamaica
Immigrants from Poland
College, Under 1 year
College, Under 1 year Comparison
Immigrants from Jamaica
Immigrants from Poland
59.7%
COLLEGE, UNDER 1 YEAR
0.0/ 100
METRIC RATING
283rd/ 347
METRIC RANK
65.2%
COLLEGE, UNDER 1 YEAR
42.6/ 100
METRIC RATING
183rd/ 347
METRIC RANK
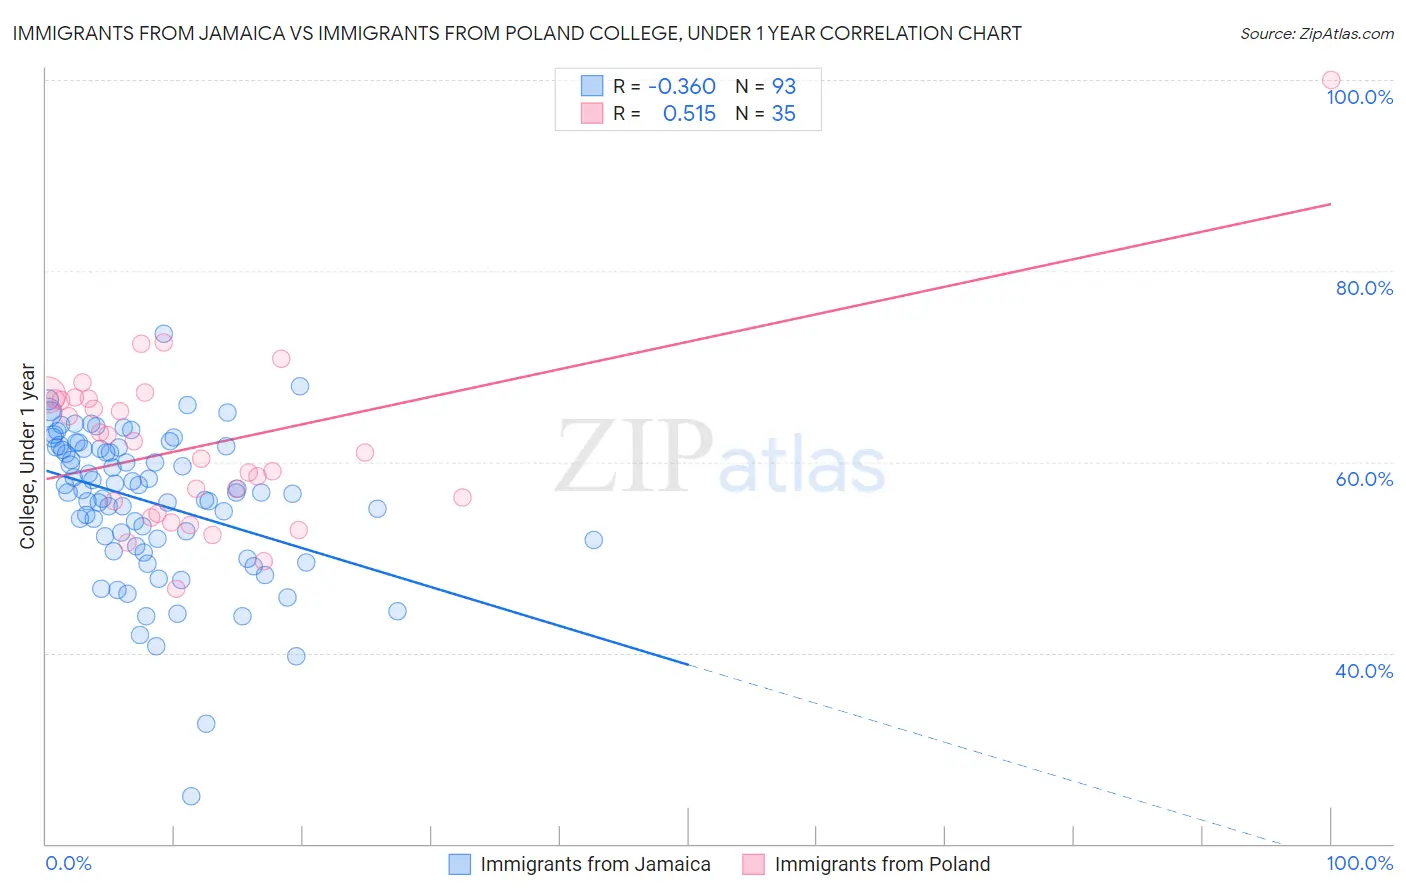
Immigrants from Jamaica vs Immigrants from Poland College, Under 1 year Correlation Chart
The statistical analysis conducted on geographies consisting of 301,826,603 people shows a mild negative correlation between the proportion of Immigrants from Jamaica and percentage of population with at least college, under 1 year education in the United States with a correlation coefficient (R) of -0.360 and weighted average of 59.7%. Similarly, the statistical analysis conducted on geographies consisting of 304,861,877 people shows a substantial positive correlation between the proportion of Immigrants from Poland and percentage of population with at least college, under 1 year education in the United States with a correlation coefficient (R) of 0.515 and weighted average of 65.2%, a difference of 9.2%.
College, Under 1 year Correlation Summary
| Measurement | Immigrants from Jamaica | Immigrants from Poland |
| Minimum | 24.9% | 46.7% |
| Maximum | 73.4% | 100.0% |
| Range | 48.5% | 53.3% |
| Mean | 55.8% | 61.8% |
| Median | 56.8% | 61.0% |
| Interquartile 25% (IQ1) | 51.5% | 54.6% |
| Interquartile 75% (IQ3) | 61.5% | 66.6% |
| Interquartile Range (IQR) | 10.0% | 12.0% |
| Standard Deviation (Sample) | 7.9% | 9.4% |
| Standard Deviation (Population) | 7.8% | 9.3% |
Similar Demographics by College, Under 1 year
Demographics Similar to Immigrants from Jamaica by College, Under 1 year
In terms of college, under 1 year, the demographic groups most similar to Immigrants from Jamaica are Immigrants from St. Vincent and the Grenadines (59.6%, a difference of 0.11%), Paiute (59.6%, a difference of 0.12%), British West Indian (59.5%, a difference of 0.27%), Sioux (59.4%, a difference of 0.44%), and Black/African American (59.4%, a difference of 0.54%).
| Demographics | Rating | Rank | College, Under 1 year |
| Arapaho | 0.1 /100 | #276 | Tragic 60.3% |
| Bahamians | 0.1 /100 | #277 | Tragic 60.3% |
| Yaqui | 0.1 /100 | #278 | Tragic 60.2% |
| Ute | 0.1 /100 | #279 | Tragic 60.2% |
| Crow | 0.1 /100 | #280 | Tragic 60.2% |
| Cherokee | 0.1 /100 | #281 | Tragic 60.1% |
| Belizeans | 0.1 /100 | #282 | Tragic 60.1% |
| Immigrants | Jamaica | 0.0 /100 | #283 | Tragic 59.7% |
| Immigrants | St. Vincent and the Grenadines | 0.0 /100 | #284 | Tragic 59.6% |
| Paiute | 0.0 /100 | #285 | Tragic 59.6% |
| British West Indians | 0.0 /100 | #286 | Tragic 59.5% |
| Sioux | 0.0 /100 | #287 | Tragic 59.4% |
| Blacks/African Americans | 0.0 /100 | #288 | Tragic 59.4% |
| Choctaw | 0.0 /100 | #289 | Tragic 59.3% |
| Ecuadorians | 0.0 /100 | #290 | Tragic 59.3% |
Demographics Similar to Immigrants from Poland by College, Under 1 year
In terms of college, under 1 year, the demographic groups most similar to Immigrants from Poland are Bermudan (65.2%, a difference of 0.030%), Sri Lankan (65.2%, a difference of 0.040%), Immigrants from Africa (65.3%, a difference of 0.10%), Spaniard (65.3%, a difference of 0.13%), and Immigrants from Sierra Leone (65.1%, a difference of 0.13%).
| Demographics | Rating | Rank | College, Under 1 year |
| French | 48.9 /100 | #176 | Average 65.4% |
| Immigrants | North Macedonia | 48.6 /100 | #177 | Average 65.4% |
| German Russians | 48.3 /100 | #178 | Average 65.4% |
| Guamanians/Chamorros | 48.2 /100 | #179 | Average 65.4% |
| Dutch | 46.1 /100 | #180 | Average 65.3% |
| Spaniards | 45.5 /100 | #181 | Average 65.3% |
| Immigrants | Africa | 44.7 /100 | #182 | Average 65.3% |
| Immigrants | Poland | 42.6 /100 | #183 | Average 65.2% |
| Bermudans | 42.0 /100 | #184 | Average 65.2% |
| Sri Lankans | 41.7 /100 | #185 | Average 65.2% |
| Immigrants | Sierra Leone | 39.7 /100 | #186 | Fair 65.1% |
| Immigrants | Southern Europe | 34.3 /100 | #187 | Fair 64.9% |
| Immigrants | Albania | 32.0 /100 | #188 | Fair 64.9% |
| Spanish | 31.6 /100 | #189 | Fair 64.9% |
| Immigrants | Philippines | 30.1 /100 | #190 | Fair 64.8% |