Immigrants from Eritrea vs White/Caucasian Associate's Degree
COMPARE
Immigrants from Eritrea
White/Caucasian
Associate's Degree
Associate's Degree Comparison
Immigrants from Eritrea
Whites/Caucasians
48.1%
ASSOCIATE'S DEGREE
87.8/ 100
METRIC RATING
137th/ 347
METRIC RANK
44.2%
ASSOCIATE'S DEGREE
7.5/ 100
METRIC RATING
219th/ 347
METRIC RANK
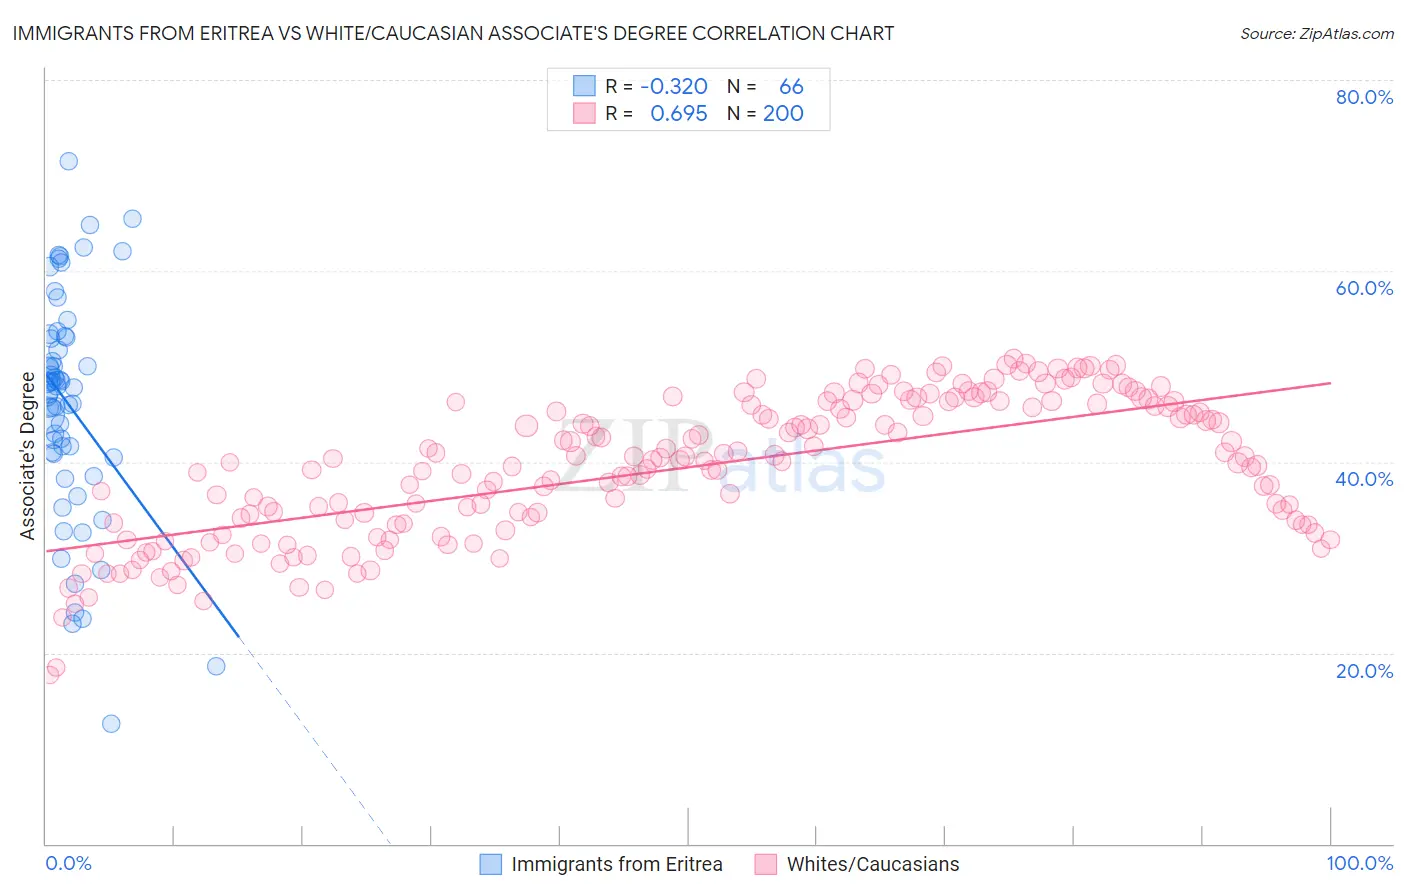
Immigrants from Eritrea vs White/Caucasian Associate's Degree Correlation Chart
The statistical analysis conducted on geographies consisting of 104,852,788 people shows a mild negative correlation between the proportion of Immigrants from Eritrea and percentage of population with at least associate's degree education in the United States with a correlation coefficient (R) of -0.320 and weighted average of 48.1%. Similarly, the statistical analysis conducted on geographies consisting of 584,984,374 people shows a significant positive correlation between the proportion of Whites/Caucasians and percentage of population with at least associate's degree education in the United States with a correlation coefficient (R) of 0.695 and weighted average of 44.2%, a difference of 8.8%.
Associate's Degree Correlation Summary
| Measurement | Immigrants from Eritrea | White/Caucasian |
| Minimum | 12.6% | 17.7% |
| Maximum | 71.5% | 50.8% |
| Range | 58.9% | 33.1% |
| Mean | 46.0% | 39.4% |
| Median | 47.9% | 40.2% |
| Interquartile 25% (IQ1) | 40.9% | 33.5% |
| Interquartile 75% (IQ3) | 53.1% | 46.2% |
| Interquartile Range (IQR) | 12.2% | 12.6% |
| Standard Deviation (Sample) | 11.9% | 7.3% |
| Standard Deviation (Population) | 11.8% | 7.3% |
Similar Demographics by Associate's Degree
Demographics Similar to Immigrants from Eritrea by Associate's Degree
In terms of associate's degree, the demographic groups most similar to Immigrants from Eritrea are Pakistani (48.1%, a difference of 0.040%), Polish (48.0%, a difference of 0.070%), European (48.2%, a difference of 0.22%), Moroccan (48.2%, a difference of 0.28%), and Assyrian/Chaldean/Syriac (48.2%, a difference of 0.30%).
| Demographics | Rating | Rank | Associate's Degree |
| Immigrants | Jordan | 91.2 /100 | #130 | Exceptional 48.4% |
| Icelanders | 90.8 /100 | #131 | Exceptional 48.3% |
| Immigrants | Albania | 89.9 /100 | #132 | Excellent 48.2% |
| Assyrians/Chaldeans/Syriacs | 89.4 /100 | #133 | Excellent 48.2% |
| Moroccans | 89.3 /100 | #134 | Excellent 48.2% |
| Europeans | 89.0 /100 | #135 | Excellent 48.2% |
| Pakistanis | 88.0 /100 | #136 | Excellent 48.1% |
| Immigrants | Eritrea | 87.8 /100 | #137 | Excellent 48.1% |
| Poles | 87.3 /100 | #138 | Excellent 48.0% |
| Slovenes | 85.1 /100 | #139 | Excellent 47.9% |
| Immigrants | Southern Europe | 84.4 /100 | #140 | Excellent 47.8% |
| Taiwanese | 83.3 /100 | #141 | Excellent 47.7% |
| Sierra Leoneans | 82.9 /100 | #142 | Excellent 47.7% |
| Norwegians | 81.0 /100 | #143 | Excellent 47.6% |
| Slavs | 80.5 /100 | #144 | Excellent 47.6% |
Demographics Similar to Whites/Caucasians by Associate's Degree
In terms of associate's degree, the demographic groups most similar to Whites/Caucasians are Portuguese (44.1%, a difference of 0.070%), Immigrants from Western Africa (44.1%, a difference of 0.27%), Spanish (44.4%, a difference of 0.48%), Barbadian (43.9%, a difference of 0.54%), and Subsaharan African (43.9%, a difference of 0.64%).
| Demographics | Rating | Rank | Associate's Degree |
| French Canadians | 15.0 /100 | #212 | Poor 44.9% |
| Immigrants | Ghana | 14.2 /100 | #213 | Poor 44.8% |
| Immigrants | Middle Africa | 12.7 /100 | #214 | Poor 44.7% |
| Immigrants | Panama | 12.4 /100 | #215 | Poor 44.7% |
| Immigrants | Nigeria | 11.4 /100 | #216 | Poor 44.6% |
| Immigrants | Immigrants | 10.5 /100 | #217 | Poor 44.5% |
| Spanish | 9.4 /100 | #218 | Tragic 44.4% |
| Whites/Caucasians | 7.5 /100 | #219 | Tragic 44.2% |
| Portuguese | 7.2 /100 | #220 | Tragic 44.1% |
| Immigrants | Western Africa | 6.6 /100 | #221 | Tragic 44.1% |
| Barbadians | 5.8 /100 | #222 | Tragic 43.9% |
| Sub-Saharan Africans | 5.5 /100 | #223 | Tragic 43.9% |
| West Indians | 5.2 /100 | #224 | Tragic 43.8% |
| Guamanians/Chamorros | 4.8 /100 | #225 | Tragic 43.8% |
| Immigrants | Burma/Myanmar | 4.3 /100 | #226 | Tragic 43.7% |