Immigrants from Iraq vs White/Caucasian Median Family Income
COMPARE
Immigrants from Iraq
White/Caucasian
Median Family Income
Median Family Income Comparison
Immigrants from Iraq
Whites/Caucasians
$98,786
MEDIAN FAMILY INCOME
12.1/ 100
METRIC RATING
206th/ 347
METRIC RANK
$99,800
MEDIAN FAMILY INCOME
18.7/ 100
METRIC RATING
202nd/ 347
METRIC RANK
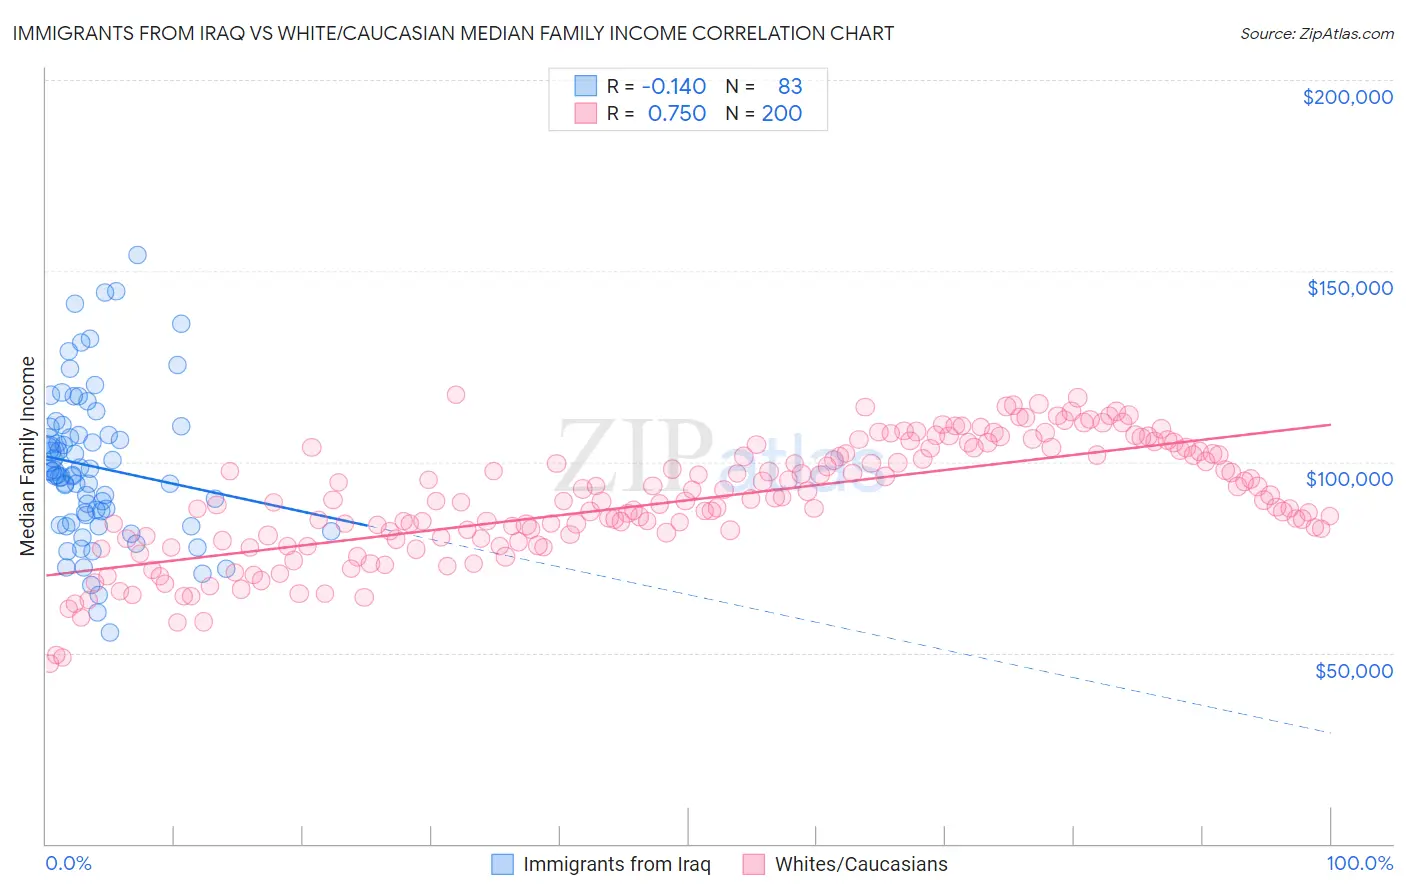
Immigrants from Iraq vs White/Caucasian Median Family Income Correlation Chart
The statistical analysis conducted on geographies consisting of 194,718,610 people shows a poor negative correlation between the proportion of Immigrants from Iraq and median family income in the United States with a correlation coefficient (R) of -0.140 and weighted average of $98,786. Similarly, the statistical analysis conducted on geographies consisting of 582,814,142 people shows a strong positive correlation between the proportion of Whites/Caucasians and median family income in the United States with a correlation coefficient (R) of 0.750 and weighted average of $99,800, a difference of 1.0%.
Median Family Income Correlation Summary
| Measurement | Immigrants from Iraq | White/Caucasian |
| Minimum | $55,430 | $47,087 |
| Maximum | $154,107 | $117,539 |
| Range | $98,677 | $70,452 |
| Mean | $98,657 | $89,997 |
| Median | $96,637 | $89,813 |
| Interquartile 25% (IQ1) | $83,994 | $80,036 |
| Interquartile 75% (IQ3) | $108,953 | $102,904 |
| Interquartile Range (IQR) | $24,960 | $22,868 |
| Standard Deviation (Sample) | $19,813 | $15,237 |
| Standard Deviation (Population) | $19,693 | $15,199 |
Demographics Similar to Immigrants from Iraq and Whites/Caucasians by Median Family Income
In terms of median family income, the demographic groups most similar to Immigrants from Iraq are Hawaiian ($98,869, a difference of 0.080%), Aleut ($98,702, a difference of 0.080%), Ghanaian ($98,877, a difference of 0.090%), Immigrants from Uruguay ($98,205, a difference of 0.59%), and Immigrants from Colombia ($98,067, a difference of 0.73%). Similarly, the demographic groups most similar to Whites/Caucasians are Immigrants from Thailand ($99,840, a difference of 0.040%), Spanish ($99,977, a difference of 0.18%), Scotch-Irish ($99,591, a difference of 0.21%), Yugoslavian ($100,119, a difference of 0.32%), and Immigrants from Africa ($100,256, a difference of 0.46%).
| Demographics | Rating | Rank | Median Family Income |
| Uruguayans | 26.3 /100 | #194 | Fair $100,656 |
| Immigrants | South America | 23.9 /100 | #195 | Fair $100,414 |
| Samoans | 23.3 /100 | #196 | Fair $100,344 |
| Immigrants | Cameroon | 22.8 /100 | #197 | Fair $100,289 |
| Immigrants | Africa | 22.5 /100 | #198 | Fair $100,256 |
| Yugoslavians | 21.3 /100 | #199 | Fair $100,119 |
| Spanish | 20.1 /100 | #200 | Fair $99,977 |
| Immigrants | Thailand | 19.0 /100 | #201 | Poor $99,840 |
| Whites/Caucasians | 18.7 /100 | #202 | Poor $99,800 |
| Scotch-Irish | 17.1 /100 | #203 | Poor $99,591 |
| Ghanaians | 12.6 /100 | #204 | Poor $98,877 |
| Hawaiians | 12.5 /100 | #205 | Poor $98,869 |
| Immigrants | Iraq | 12.1 /100 | #206 | Poor $98,786 |
| Aleuts | 11.6 /100 | #207 | Poor $98,702 |
| Immigrants | Uruguay | 9.2 /100 | #208 | Tragic $98,205 |
| Immigrants | Colombia | 8.7 /100 | #209 | Tragic $98,067 |
| Puget Sound Salish | 8.2 /100 | #210 | Tragic $97,958 |
| Immigrants | Sudan | 7.4 /100 | #211 | Tragic $97,737 |
| Panamanians | 7.2 /100 | #212 | Tragic $97,683 |
| Immigrants | Armenia | 7.0 /100 | #213 | Tragic $97,605 |
| Bermudans | 6.9 /100 | #214 | Tragic $97,577 |