Immigrants from St. Vincent and the Grenadines vs White/Caucasian Associate's Degree
COMPARE
Immigrants from St. Vincent and the Grenadines
White/Caucasian
Associate's Degree
Associate's Degree Comparison
Immigrants from St. Vincent and the Grenadines
Whites/Caucasians
42.9%
ASSOCIATE'S DEGREE
1.9/ 100
METRIC RATING
236th/ 347
METRIC RANK
44.2%
ASSOCIATE'S DEGREE
7.5/ 100
METRIC RATING
219th/ 347
METRIC RANK
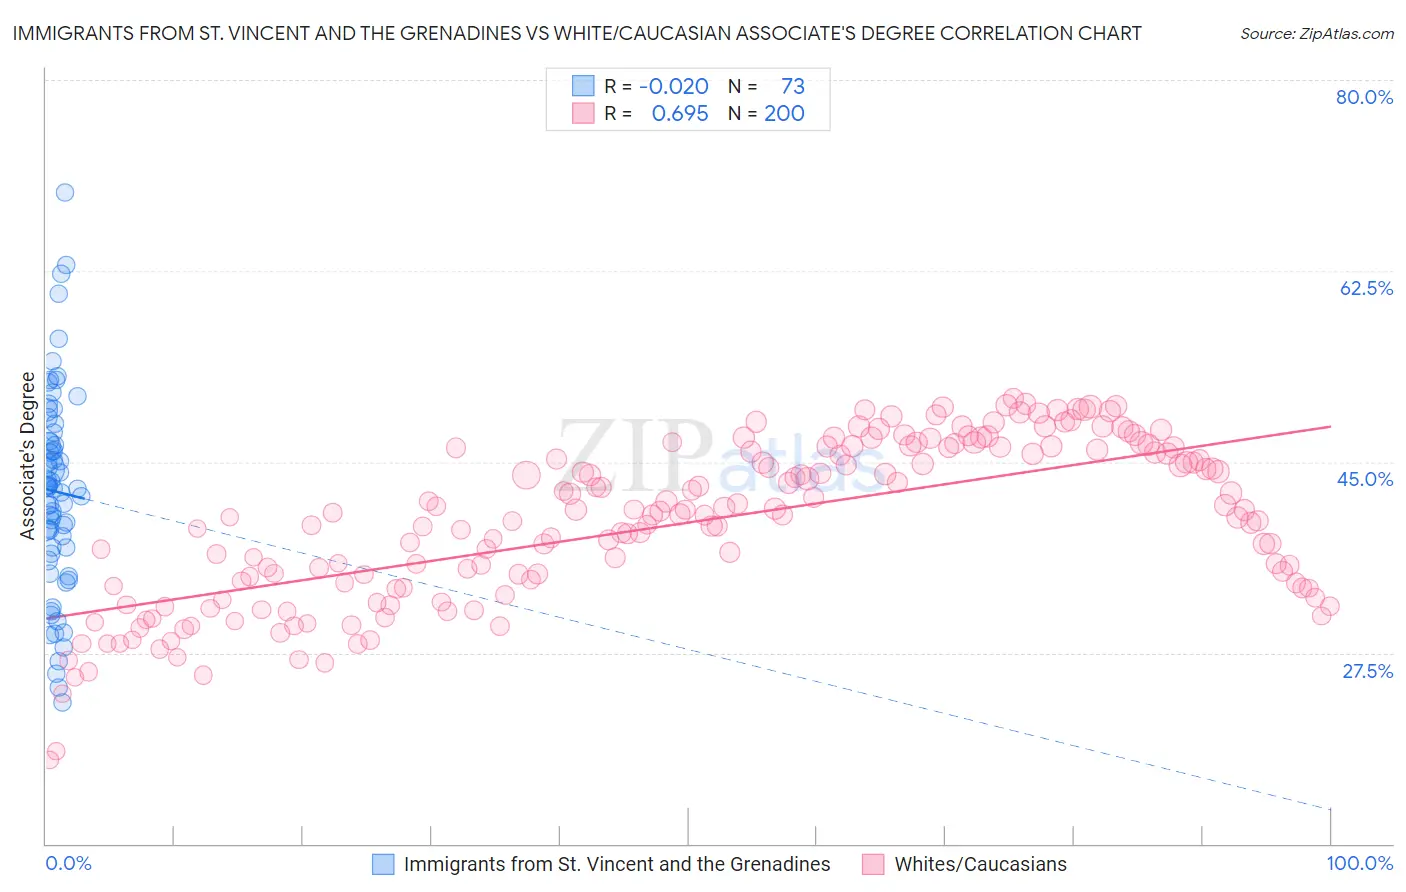
Immigrants from St. Vincent and the Grenadines vs White/Caucasian Associate's Degree Correlation Chart
The statistical analysis conducted on geographies consisting of 56,191,418 people shows no correlation between the proportion of Immigrants from St. Vincent and the Grenadines and percentage of population with at least associate's degree education in the United States with a correlation coefficient (R) of -0.020 and weighted average of 42.9%. Similarly, the statistical analysis conducted on geographies consisting of 584,984,374 people shows a significant positive correlation between the proportion of Whites/Caucasians and percentage of population with at least associate's degree education in the United States with a correlation coefficient (R) of 0.695 and weighted average of 44.2%, a difference of 2.9%.
Associate's Degree Correlation Summary
| Measurement | Immigrants from St. Vincent and the Grenadines | White/Caucasian |
| Minimum | 23.0% | 17.7% |
| Maximum | 69.7% | 50.8% |
| Range | 46.7% | 33.1% |
| Mean | 42.3% | 39.4% |
| Median | 42.6% | 40.2% |
| Interquartile 25% (IQ1) | 36.9% | 33.5% |
| Interquartile 75% (IQ3) | 47.3% | 46.2% |
| Interquartile Range (IQR) | 10.4% | 12.6% |
| Standard Deviation (Sample) | 9.2% | 7.3% |
| Standard Deviation (Population) | 9.2% | 7.3% |
Demographics Similar to Immigrants from St. Vincent and the Grenadines and Whites/Caucasians by Associate's Degree
In terms of associate's degree, the demographic groups most similar to Immigrants from St. Vincent and the Grenadines are Nonimmigrants (42.9%, a difference of 0.020%), Ecuadorian (43.0%, a difference of 0.080%), Tlingit-Haida (43.0%, a difference of 0.18%), Tongan (43.0%, a difference of 0.27%), and Native Hawaiian (43.1%, a difference of 0.43%). Similarly, the demographic groups most similar to Whites/Caucasians are Portuguese (44.1%, a difference of 0.070%), Immigrants from Western Africa (44.1%, a difference of 0.27%), Spanish (44.4%, a difference of 0.48%), Barbadian (43.9%, a difference of 0.54%), and Subsaharan African (43.9%, a difference of 0.64%).
| Demographics | Rating | Rank | Associate's Degree |
| Immigrants | Immigrants | 10.5 /100 | #217 | Poor 44.5% |
| Spanish | 9.4 /100 | #218 | Tragic 44.4% |
| Whites/Caucasians | 7.5 /100 | #219 | Tragic 44.2% |
| Portuguese | 7.2 /100 | #220 | Tragic 44.1% |
| Immigrants | Western Africa | 6.6 /100 | #221 | Tragic 44.1% |
| Barbadians | 5.8 /100 | #222 | Tragic 43.9% |
| Sub-Saharan Africans | 5.5 /100 | #223 | Tragic 43.9% |
| West Indians | 5.2 /100 | #224 | Tragic 43.8% |
| Guamanians/Chamorros | 4.8 /100 | #225 | Tragic 43.8% |
| Immigrants | Burma/Myanmar | 4.3 /100 | #226 | Tragic 43.7% |
| Trinidadians and Tobagonians | 4.0 /100 | #227 | Tragic 43.6% |
| Hmong | 3.2 /100 | #228 | Tragic 43.4% |
| Immigrants | Trinidad and Tobago | 3.0 /100 | #229 | Tragic 43.3% |
| Immigrants | Barbados | 2.9 /100 | #230 | Tragic 43.3% |
| Liberians | 2.9 /100 | #231 | Tragic 43.3% |
| Native Hawaiians | 2.3 /100 | #232 | Tragic 43.1% |
| Tongans | 2.2 /100 | #233 | Tragic 43.0% |
| Tlingit-Haida | 2.1 /100 | #234 | Tragic 43.0% |
| Ecuadorians | 2.0 /100 | #235 | Tragic 43.0% |
| Immigrants | St. Vincent and the Grenadines | 1.9 /100 | #236 | Tragic 42.9% |
| Immigrants | Nonimmigrants | 1.9 /100 | #237 | Tragic 42.9% |