Immigrants from Iraq vs Salvadoran Median Earnings
COMPARE
Immigrants from Iraq
Salvadoran
Median Earnings
Median Earnings Comparison
Immigrants from Iraq
Salvadorans
$44,988
MEDIAN EARNINGS
11.6/ 100
METRIC RATING
228th/ 347
METRIC RANK
$42,912
MEDIAN EARNINGS
0.7/ 100
METRIC RATING
265th/ 347
METRIC RANK
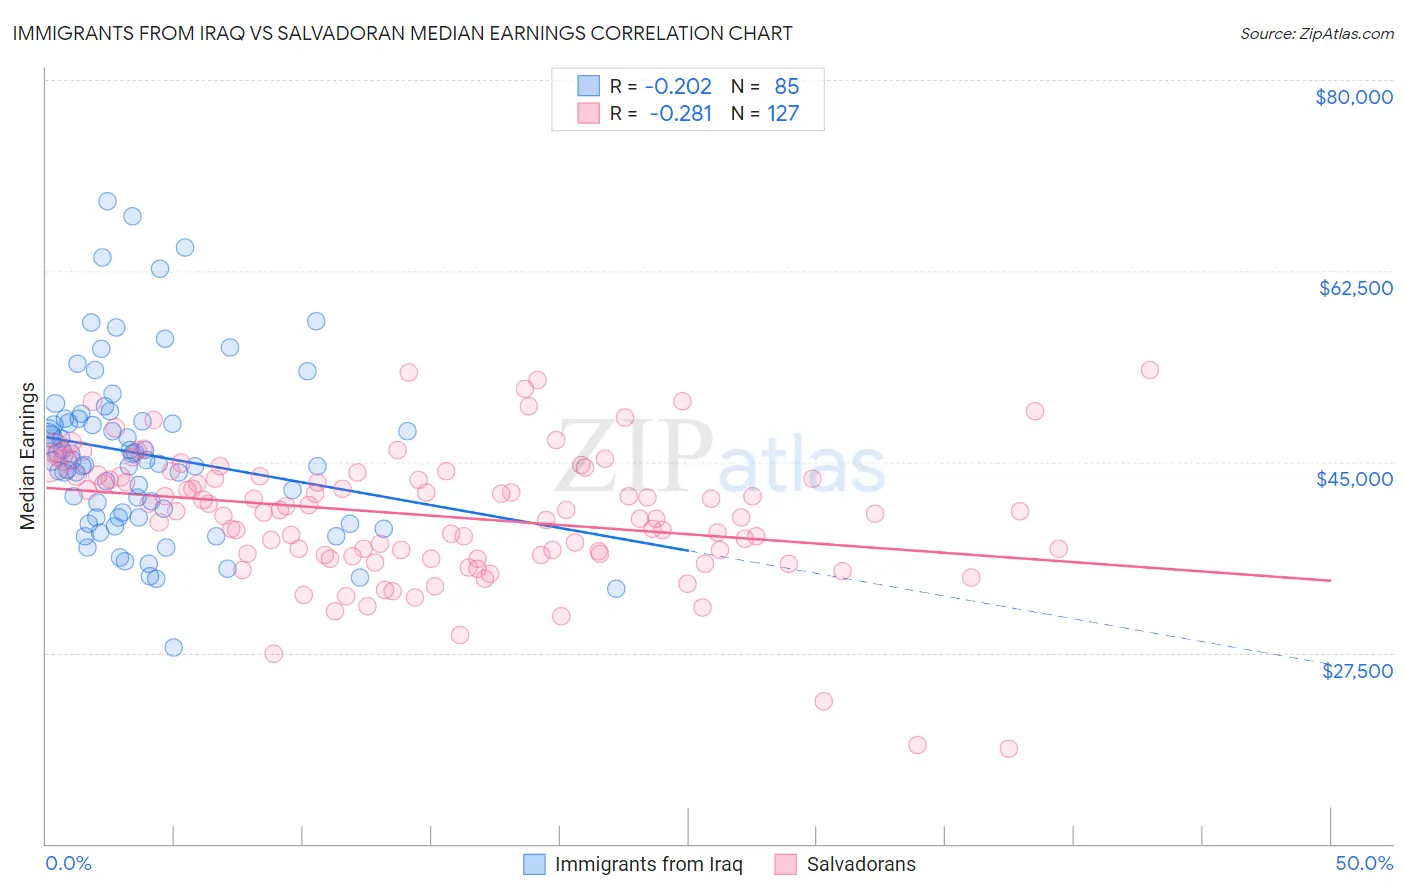
Immigrants from Iraq vs Salvadoran Median Earnings Correlation Chart
The statistical analysis conducted on geographies consisting of 194,784,427 people shows a weak negative correlation between the proportion of Immigrants from Iraq and median earnings in the United States with a correlation coefficient (R) of -0.202 and weighted average of $44,988. Similarly, the statistical analysis conducted on geographies consisting of 398,992,424 people shows a weak negative correlation between the proportion of Salvadorans and median earnings in the United States with a correlation coefficient (R) of -0.281 and weighted average of $42,912, a difference of 4.8%.
Median Earnings Correlation Summary
| Measurement | Immigrants from Iraq | Salvadoran |
| Minimum | $27,932 | $18,725 |
| Maximum | $68,937 | $53,384 |
| Range | $41,005 | $34,659 |
| Mean | $45,692 | $40,078 |
| Median | $45,037 | $40,477 |
| Interquartile 25% (IQ1) | $39,916 | $36,514 |
| Interquartile 75% (IQ3) | $48,838 | $43,731 |
| Interquartile Range (IQR) | $8,923 | $7,217 |
| Standard Deviation (Sample) | $7,829 | $6,041 |
| Standard Deviation (Population) | $7,782 | $6,017 |
Similar Demographics by Median Earnings
Demographics Similar to Immigrants from Iraq by Median Earnings
In terms of median earnings, the demographic groups most similar to Immigrants from Iraq are Immigrants from Nigeria ($45,030, a difference of 0.090%), Native Hawaiian ($45,027, a difference of 0.090%), Scotch-Irish ($44,924, a difference of 0.14%), Immigrants from Western Africa ($44,893, a difference of 0.21%), and Immigrants from Cambodia ($45,090, a difference of 0.22%).
| Demographics | Rating | Rank | Median Earnings |
| Immigrants | Guyana | 15.1 /100 | #221 | Poor $45,204 |
| Immigrants | Panama | 15.0 /100 | #222 | Poor $45,198 |
| Whites/Caucasians | 15.0 /100 | #223 | Poor $45,197 |
| West Indians | 13.9 /100 | #224 | Poor $45,132 |
| Immigrants | Cambodia | 13.2 /100 | #225 | Poor $45,090 |
| Immigrants | Nigeria | 12.2 /100 | #226 | Poor $45,030 |
| Native Hawaiians | 12.2 /100 | #227 | Poor $45,027 |
| Immigrants | Iraq | 11.6 /100 | #228 | Poor $44,988 |
| Scotch-Irish | 10.7 /100 | #229 | Poor $44,924 |
| Immigrants | Western Africa | 10.3 /100 | #230 | Poor $44,893 |
| Japanese | 9.5 /100 | #231 | Tragic $44,825 |
| Delaware | 9.0 /100 | #232 | Tragic $44,783 |
| Immigrants | Sudan | 8.8 /100 | #233 | Tragic $44,767 |
| Cape Verdeans | 7.5 /100 | #234 | Tragic $44,640 |
| Venezuelans | 6.9 /100 | #235 | Tragic $44,580 |
Demographics Similar to Salvadorans by Median Earnings
In terms of median earnings, the demographic groups most similar to Salvadorans are Immigrants from Liberia ($42,923, a difference of 0.030%), Immigrants from Laos ($42,884, a difference of 0.060%), Inupiat ($43,000, a difference of 0.20%), Immigrants from Jamaica ($43,026, a difference of 0.27%), and Nicaraguan ($43,026, a difference of 0.27%).
| Demographics | Rating | Rank | Median Earnings |
| French American Indians | 1.3 /100 | #258 | Tragic $43,333 |
| German Russians | 1.1 /100 | #259 | Tragic $43,200 |
| Immigrants | Somalia | 0.9 /100 | #260 | Tragic $43,100 |
| Immigrants | Jamaica | 0.8 /100 | #261 | Tragic $43,026 |
| Nicaraguans | 0.8 /100 | #262 | Tragic $43,026 |
| Inupiat | 0.8 /100 | #263 | Tragic $43,000 |
| Immigrants | Liberia | 0.7 /100 | #264 | Tragic $42,923 |
| Salvadorans | 0.7 /100 | #265 | Tragic $42,912 |
| Immigrants | Laos | 0.7 /100 | #266 | Tragic $42,884 |
| Cree | 0.6 /100 | #267 | Tragic $42,777 |
| Americans | 0.6 /100 | #268 | Tragic $42,742 |
| Belizeans | 0.5 /100 | #269 | Tragic $42,702 |
| Osage | 0.5 /100 | #270 | Tragic $42,651 |
| Pennsylvania Germans | 0.5 /100 | #271 | Tragic $42,615 |
| Iroquois | 0.4 /100 | #272 | Tragic $42,430 |