Immigrants from Ukraine vs Salvadoran Associate's Degree
COMPARE
Immigrants from Ukraine
Salvadoran
Associate's Degree
Associate's Degree Comparison
Immigrants from Ukraine
Salvadorans
49.7%
ASSOCIATE'S DEGREE
98.0/ 100
METRIC RATING
97th/ 347
METRIC RANK
39.0%
ASSOCIATE'S DEGREE
0.0/ 100
METRIC RATING
294th/ 347
METRIC RANK
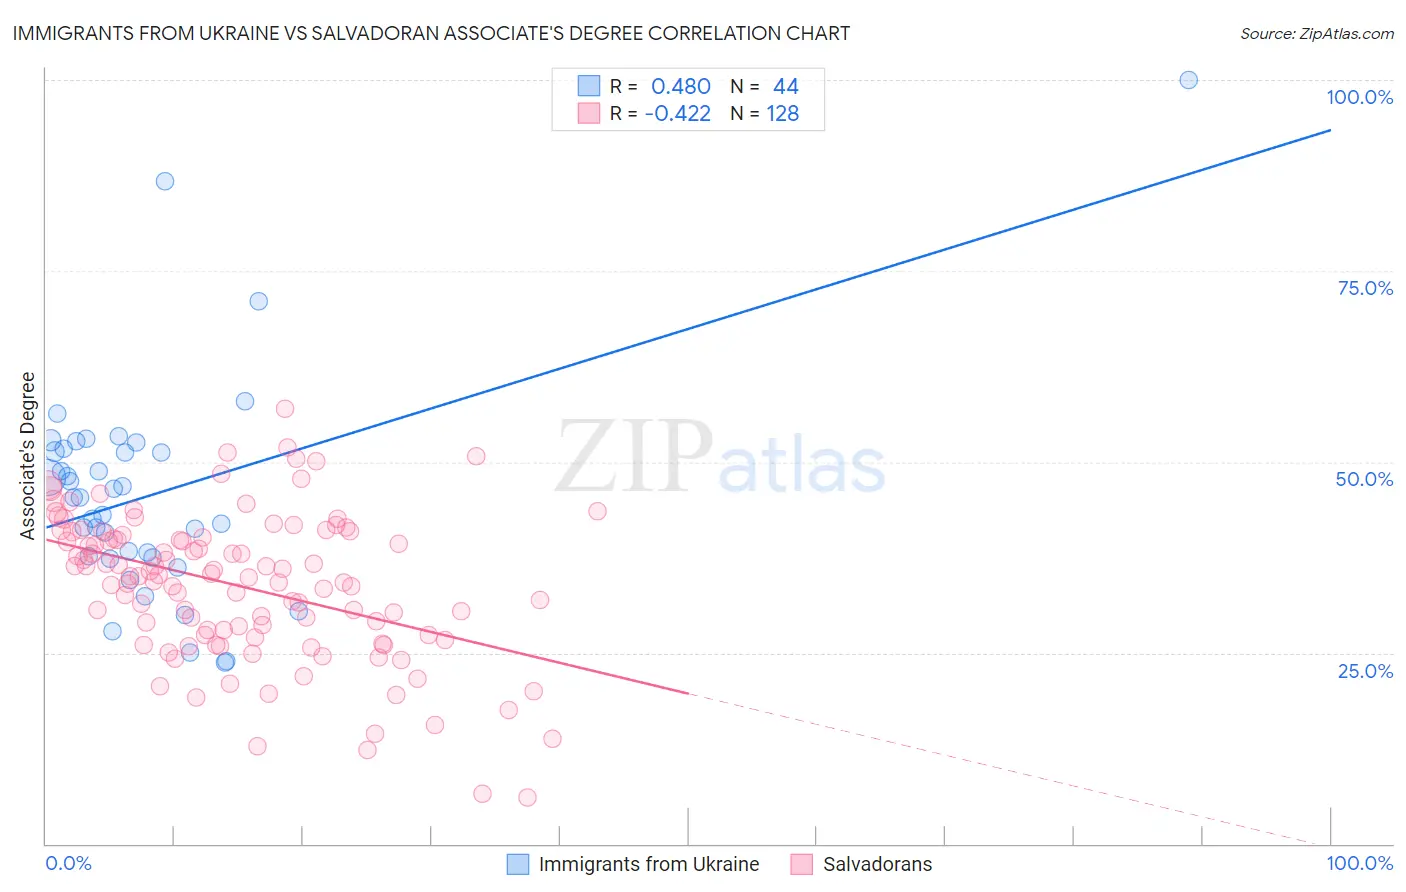
Immigrants from Ukraine vs Salvadoran Associate's Degree Correlation Chart
The statistical analysis conducted on geographies consisting of 289,711,904 people shows a moderate positive correlation between the proportion of Immigrants from Ukraine and percentage of population with at least associate's degree education in the United States with a correlation coefficient (R) of 0.480 and weighted average of 49.7%. Similarly, the statistical analysis conducted on geographies consisting of 399,027,766 people shows a moderate negative correlation between the proportion of Salvadorans and percentage of population with at least associate's degree education in the United States with a correlation coefficient (R) of -0.422 and weighted average of 39.0%, a difference of 27.4%.
Associate's Degree Correlation Summary
| Measurement | Immigrants from Ukraine | Salvadoran |
| Minimum | 23.7% | 6.1% |
| Maximum | 100.0% | 57.0% |
| Range | 76.3% | 50.9% |
| Mean | 45.7% | 33.7% |
| Median | 45.3% | 35.0% |
| Interquartile 25% (IQ1) | 37.5% | 27.3% |
| Interquartile 75% (IQ3) | 51.5% | 40.3% |
| Interquartile Range (IQR) | 14.0% | 12.9% |
| Standard Deviation (Sample) | 14.5% | 9.6% |
| Standard Deviation (Population) | 14.3% | 9.5% |
Similar Demographics by Associate's Degree
Demographics Similar to Immigrants from Ukraine by Associate's Degree
In terms of associate's degree, the demographic groups most similar to Immigrants from Ukraine are Romanian (49.7%, a difference of 0.0%), Immigrants from England (49.7%, a difference of 0.020%), Immigrants from Northern Africa (49.7%, a difference of 0.090%), Macedonian (49.6%, a difference of 0.16%), and Immigrants from Nepal (49.5%, a difference of 0.38%).
| Demographics | Rating | Rank | Associate's Degree |
| Immigrants | Ethiopia | 98.7 /100 | #90 | Exceptional 50.1% |
| Immigrants | Western Asia | 98.7 /100 | #91 | Exceptional 50.1% |
| Immigrants | North America | 98.7 /100 | #92 | Exceptional 50.1% |
| Immigrants | Brazil | 98.5 /100 | #93 | Exceptional 50.0% |
| Laotians | 98.4 /100 | #94 | Exceptional 49.9% |
| Immigrants | England | 98.0 /100 | #95 | Exceptional 49.7% |
| Romanians | 98.0 /100 | #96 | Exceptional 49.7% |
| Immigrants | Ukraine | 98.0 /100 | #97 | Exceptional 49.7% |
| Immigrants | Northern Africa | 97.9 /100 | #98 | Exceptional 49.7% |
| Macedonians | 97.8 /100 | #99 | Exceptional 49.6% |
| Immigrants | Nepal | 97.5 /100 | #100 | Exceptional 49.5% |
| Northern Europeans | 97.3 /100 | #101 | Exceptional 49.5% |
| Chileans | 97.3 /100 | #102 | Exceptional 49.4% |
| Ukrainians | 97.1 /100 | #103 | Exceptional 49.4% |
| Venezuelans | 97.0 /100 | #104 | Exceptional 49.4% |
Demographics Similar to Salvadorans by Associate's Degree
In terms of associate's degree, the demographic groups most similar to Salvadorans are Nepalese (39.0%, a difference of 0.0%), Black/African American (39.1%, a difference of 0.25%), Honduran (38.9%, a difference of 0.29%), Cherokee (38.9%, a difference of 0.46%), and Dominican (39.3%, a difference of 0.54%).
| Demographics | Rating | Rank | Associate's Degree |
| Aleuts | 0.0 /100 | #287 | Tragic 39.6% |
| Immigrants | Cuba | 0.0 /100 | #288 | Tragic 39.5% |
| Central Americans | 0.0 /100 | #289 | Tragic 39.4% |
| Immigrants | Haiti | 0.0 /100 | #290 | Tragic 39.3% |
| Dominicans | 0.0 /100 | #291 | Tragic 39.3% |
| Blacks/African Americans | 0.0 /100 | #292 | Tragic 39.1% |
| Nepalese | 0.0 /100 | #293 | Tragic 39.0% |
| Salvadorans | 0.0 /100 | #294 | Tragic 39.0% |
| Hondurans | 0.0 /100 | #295 | Tragic 38.9% |
| Cherokee | 0.0 /100 | #296 | Tragic 38.9% |
| Cape Verdeans | 0.0 /100 | #297 | Tragic 38.8% |
| Cheyenne | 0.0 /100 | #298 | Tragic 38.7% |
| Ute | 0.0 /100 | #299 | Tragic 38.6% |
| Chickasaw | 0.0 /100 | #300 | Tragic 38.6% |
| Tsimshian | 0.0 /100 | #301 | Tragic 38.6% |