Afghan vs Salvadoran Associate's Degree
COMPARE
Afghan
Salvadoran
Associate's Degree
Associate's Degree Comparison
Afghans
Salvadorans
48.9%
ASSOCIATE'S DEGREE
94.8/ 100
METRIC RATING
117th/ 347
METRIC RANK
39.0%
ASSOCIATE'S DEGREE
0.0/ 100
METRIC RATING
294th/ 347
METRIC RANK
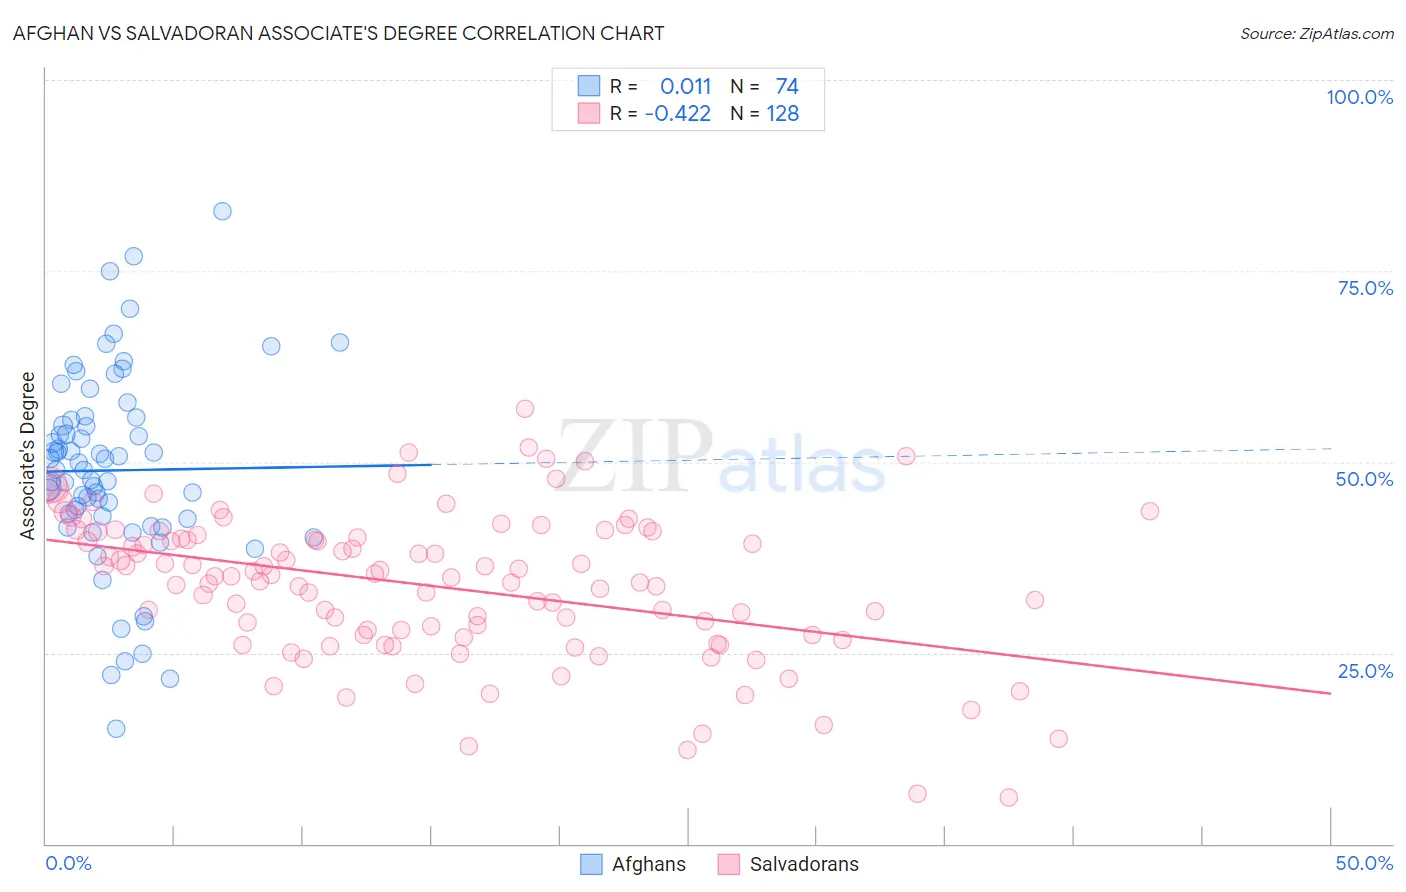
Afghan vs Salvadoran Associate's Degree Correlation Chart
The statistical analysis conducted on geographies consisting of 148,873,892 people shows no correlation between the proportion of Afghans and percentage of population with at least associate's degree education in the United States with a correlation coefficient (R) of 0.011 and weighted average of 48.9%. Similarly, the statistical analysis conducted on geographies consisting of 399,027,766 people shows a moderate negative correlation between the proportion of Salvadorans and percentage of population with at least associate's degree education in the United States with a correlation coefficient (R) of -0.422 and weighted average of 39.0%, a difference of 25.2%.
Associate's Degree Correlation Summary
| Measurement | Afghan | Salvadoran |
| Minimum | 15.1% | 6.1% |
| Maximum | 82.8% | 57.0% |
| Range | 67.7% | 50.9% |
| Mean | 48.9% | 33.7% |
| Median | 48.9% | 35.0% |
| Interquartile 25% (IQ1) | 42.6% | 27.3% |
| Interquartile 75% (IQ3) | 55.5% | 40.3% |
| Interquartile Range (IQR) | 12.9% | 12.9% |
| Standard Deviation (Sample) | 12.8% | 9.6% |
| Standard Deviation (Population) | 12.7% | 9.5% |
Similar Demographics by Associate's Degree
Demographics Similar to Afghans by Associate's Degree
In terms of associate's degree, the demographic groups most similar to Afghans are British (48.9%, a difference of 0.040%), Albanian (48.8%, a difference of 0.060%), Lebanese (48.8%, a difference of 0.070%), Alsatian (48.8%, a difference of 0.10%), and Luxembourger (48.9%, a difference of 0.11%).
| Demographics | Rating | Rank | Associate's Degree |
| Austrians | 95.8 /100 | #110 | Exceptional 49.1% |
| Immigrants | Venezuela | 95.8 /100 | #111 | Exceptional 49.1% |
| Immigrants | Chile | 95.3 /100 | #112 | Exceptional 49.0% |
| Palestinians | 95.3 /100 | #113 | Exceptional 49.0% |
| Arabs | 95.3 /100 | #114 | Exceptional 49.0% |
| Luxembourgers | 95.1 /100 | #115 | Exceptional 48.9% |
| British | 95.0 /100 | #116 | Exceptional 48.9% |
| Afghans | 94.8 /100 | #117 | Exceptional 48.9% |
| Albanians | 94.7 /100 | #118 | Exceptional 48.8% |
| Lebanese | 94.6 /100 | #119 | Exceptional 48.8% |
| Alsatians | 94.6 /100 | #120 | Exceptional 48.8% |
| Ugandans | 93.9 /100 | #121 | Exceptional 48.7% |
| Italians | 93.9 /100 | #122 | Exceptional 48.7% |
| Brazilians | 93.7 /100 | #123 | Exceptional 48.7% |
| Serbians | 92.6 /100 | #124 | Exceptional 48.5% |
Demographics Similar to Salvadorans by Associate's Degree
In terms of associate's degree, the demographic groups most similar to Salvadorans are Nepalese (39.0%, a difference of 0.0%), Black/African American (39.1%, a difference of 0.25%), Honduran (38.9%, a difference of 0.29%), Cherokee (38.9%, a difference of 0.46%), and Dominican (39.3%, a difference of 0.54%).
| Demographics | Rating | Rank | Associate's Degree |
| Aleuts | 0.0 /100 | #287 | Tragic 39.6% |
| Immigrants | Cuba | 0.0 /100 | #288 | Tragic 39.5% |
| Central Americans | 0.0 /100 | #289 | Tragic 39.4% |
| Immigrants | Haiti | 0.0 /100 | #290 | Tragic 39.3% |
| Dominicans | 0.0 /100 | #291 | Tragic 39.3% |
| Blacks/African Americans | 0.0 /100 | #292 | Tragic 39.1% |
| Nepalese | 0.0 /100 | #293 | Tragic 39.0% |
| Salvadorans | 0.0 /100 | #294 | Tragic 39.0% |
| Hondurans | 0.0 /100 | #295 | Tragic 38.9% |
| Cherokee | 0.0 /100 | #296 | Tragic 38.9% |
| Cape Verdeans | 0.0 /100 | #297 | Tragic 38.8% |
| Cheyenne | 0.0 /100 | #298 | Tragic 38.7% |
| Ute | 0.0 /100 | #299 | Tragic 38.6% |
| Chickasaw | 0.0 /100 | #300 | Tragic 38.6% |
| Tsimshian | 0.0 /100 | #301 | Tragic 38.6% |