Immigrants from Iraq vs Kenyan In Labor Force | Age 20-24
COMPARE
Immigrants from Iraq
Kenyan
In Labor Force | Age 20-24
In Labor Force | Age 20-24 Comparison
Immigrants from Iraq
Kenyans
76.4%
IN LABOR FORCE | AGE 20-24
99.3/ 100
METRIC RATING
86th/ 347
METRIC RANK
77.0%
IN LABOR FORCE | AGE 20-24
99.9/ 100
METRIC RATING
60th/ 347
METRIC RANK
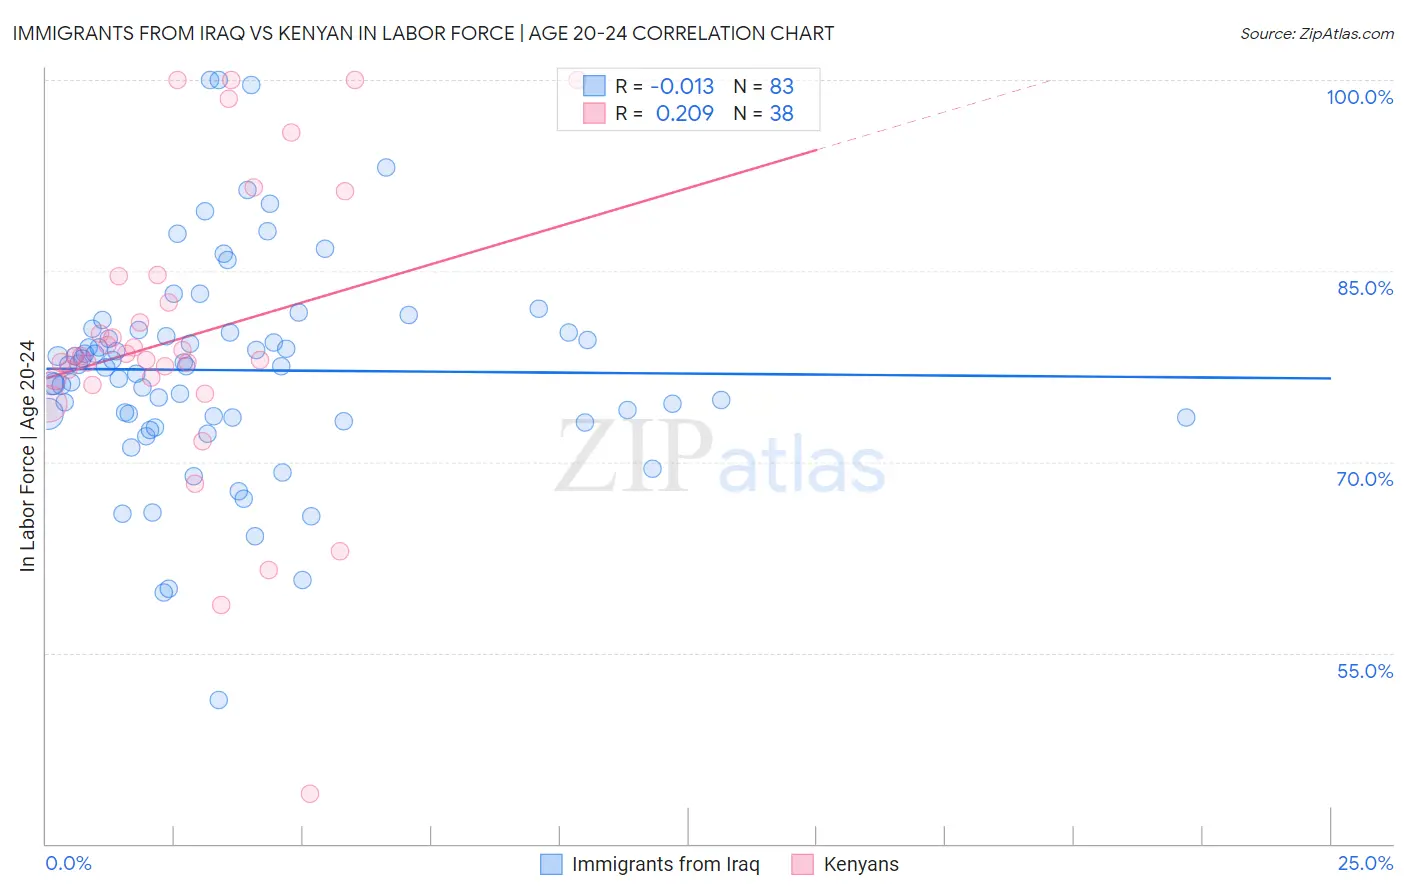
Immigrants from Iraq vs Kenyan In Labor Force | Age 20-24 Correlation Chart
The statistical analysis conducted on geographies consisting of 194,771,125 people shows no correlation between the proportion of Immigrants from Iraq and labor force participation rate among population between the ages 20 and 24 in the United States with a correlation coefficient (R) of -0.013 and weighted average of 76.4%. Similarly, the statistical analysis conducted on geographies consisting of 168,238,986 people shows a weak positive correlation between the proportion of Kenyans and labor force participation rate among population between the ages 20 and 24 in the United States with a correlation coefficient (R) of 0.209 and weighted average of 77.0%, a difference of 0.77%.
In Labor Force | Age 20-24 Correlation Summary
| Measurement | Immigrants from Iraq | Kenyan |
| Minimum | 51.3% | 43.9% |
| Maximum | 100.0% | 100.0% |
| Range | 48.7% | 56.1% |
| Mean | 77.2% | 79.8% |
| Median | 77.5% | 78.3% |
| Interquartile 25% (IQ1) | 73.5% | 76.5% |
| Interquartile 75% (IQ3) | 80.2% | 84.6% |
| Interquartile Range (IQR) | 6.7% | 8.0% |
| Standard Deviation (Sample) | 8.4% | 11.9% |
| Standard Deviation (Population) | 8.4% | 11.7% |
Similar Demographics by In Labor Force | Age 20-24
Demographics Similar to Immigrants from Iraq by In Labor Force | Age 20-24
In terms of in labor force | age 20-24, the demographic groups most similar to Immigrants from Iraq are Immigrants from Thailand (76.4%, a difference of 0.0%), Portuguese (76.4%, a difference of 0.030%), Austrian (76.5%, a difference of 0.050%), Spanish (76.4%, a difference of 0.050%), and Carpatho Rusyn (76.5%, a difference of 0.060%).
| Demographics | Rating | Rank | In Labor Force | Age 20-24 |
| Immigrants | Zaire | 99.6 /100 | #79 | Exceptional 76.6% |
| Italians | 99.6 /100 | #80 | Exceptional 76.5% |
| Basques | 99.5 /100 | #81 | Exceptional 76.5% |
| Hmong | 99.5 /100 | #82 | Exceptional 76.5% |
| Carpatho Rusyns | 99.4 /100 | #83 | Exceptional 76.5% |
| Austrians | 99.4 /100 | #84 | Exceptional 76.5% |
| Portuguese | 99.3 /100 | #85 | Exceptional 76.4% |
| Immigrants | Iraq | 99.3 /100 | #86 | Exceptional 76.4% |
| Immigrants | Thailand | 99.3 /100 | #87 | Exceptional 76.4% |
| Spanish | 99.2 /100 | #88 | Exceptional 76.4% |
| Bulgarians | 99.2 /100 | #89 | Exceptional 76.4% |
| Immigrants | Burma/Myanmar | 99.1 /100 | #90 | Exceptional 76.3% |
| Sierra Leoneans | 99.0 /100 | #91 | Exceptional 76.3% |
| Maltese | 98.9 /100 | #92 | Exceptional 76.3% |
| Hungarians | 98.9 /100 | #93 | Exceptional 76.3% |
Demographics Similar to Kenyans by In Labor Force | Age 20-24
In terms of in labor force | age 20-24, the demographic groups most similar to Kenyans are Scotch-Irish (77.0%, a difference of 0.040%), Immigrants from Eritrea (77.0%, a difference of 0.050%), Hawaiian (77.0%, a difference of 0.060%), Immigrants from Kenya (77.0%, a difference of 0.060%), and Lithuanian (77.0%, a difference of 0.060%).
| Demographics | Rating | Rank | In Labor Force | Age 20-24 |
| Immigrants | Azores | 100.0 /100 | #53 | Exceptional 77.2% |
| Celtics | 99.9 /100 | #54 | Exceptional 77.1% |
| Immigrants | Liberia | 99.9 /100 | #55 | Exceptional 77.1% |
| Europeans | 99.9 /100 | #56 | Exceptional 77.1% |
| Chippewa | 99.9 /100 | #57 | Exceptional 77.1% |
| Hawaiians | 99.9 /100 | #58 | Exceptional 77.0% |
| Scotch-Irish | 99.9 /100 | #59 | Exceptional 77.0% |
| Kenyans | 99.9 /100 | #60 | Exceptional 77.0% |
| Immigrants | Eritrea | 99.9 /100 | #61 | Exceptional 77.0% |
| Immigrants | Kenya | 99.9 /100 | #62 | Exceptional 77.0% |
| Lithuanians | 99.9 /100 | #63 | Exceptional 77.0% |
| Whites/Caucasians | 99.9 /100 | #64 | Exceptional 76.9% |
| Crow | 99.9 /100 | #65 | Exceptional 76.9% |
| Icelanders | 99.9 /100 | #66 | Exceptional 76.9% |
| Slavs | 99.9 /100 | #67 | Exceptional 76.9% |