Arapaho vs Kenyan Associate's Degree
COMPARE
Arapaho
Kenyan
Associate's Degree
Associate's Degree Comparison
Arapaho
Kenyans
36.7%
ASSOCIATE'S DEGREE
0.0/ 100
METRIC RATING
324th/ 347
METRIC RANK
47.1%
ASSOCIATE'S DEGREE
70.6/ 100
METRIC RATING
155th/ 347
METRIC RANK
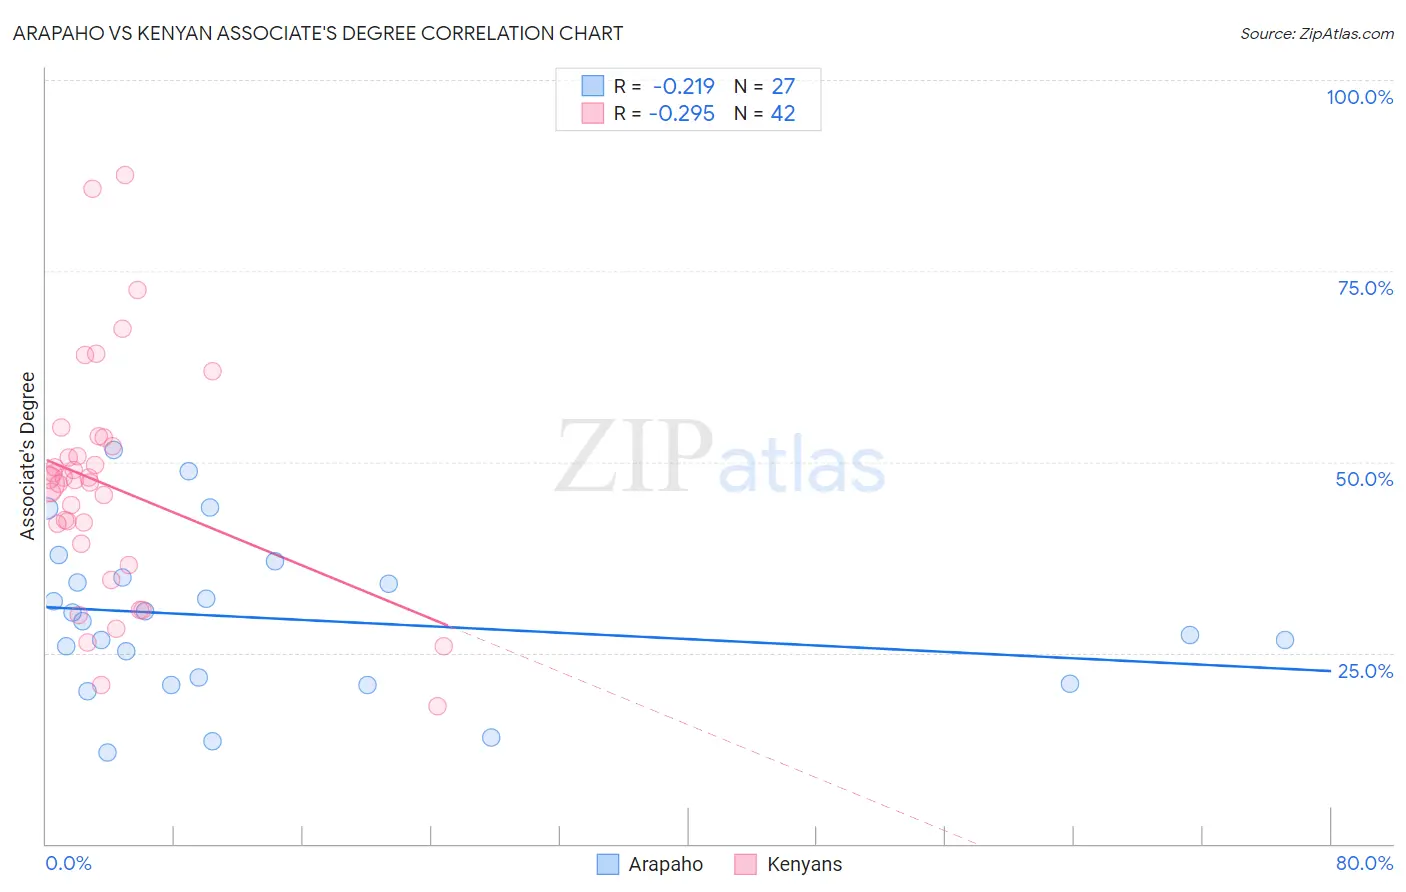
Arapaho vs Kenyan Associate's Degree Correlation Chart
The statistical analysis conducted on geographies consisting of 29,779,330 people shows a weak negative correlation between the proportion of Arapaho and percentage of population with at least associate's degree education in the United States with a correlation coefficient (R) of -0.219 and weighted average of 36.7%. Similarly, the statistical analysis conducted on geographies consisting of 168,244,481 people shows a weak negative correlation between the proportion of Kenyans and percentage of population with at least associate's degree education in the United States with a correlation coefficient (R) of -0.295 and weighted average of 47.1%, a difference of 28.3%.
Associate's Degree Correlation Summary
| Measurement | Arapaho | Kenyan |
| Minimum | 11.9% | 18.0% |
| Maximum | 51.5% | 87.6% |
| Range | 39.6% | 69.6% |
| Mean | 29.5% | 47.0% |
| Median | 29.2% | 47.5% |
| Interquartile 25% (IQ1) | 21.0% | 39.3% |
| Interquartile 75% (IQ3) | 34.8% | 52.1% |
| Interquartile Range (IQR) | 13.8% | 12.8% |
| Standard Deviation (Sample) | 10.2% | 15.0% |
| Standard Deviation (Population) | 10.0% | 14.8% |
Similar Demographics by Associate's Degree
Demographics Similar to Arapaho by Associate's Degree
In terms of associate's degree, the demographic groups most similar to Arapaho are Menominee (36.7%, a difference of 0.11%), Immigrants from Cabo Verde (36.8%, a difference of 0.16%), Kiowa (36.5%, a difference of 0.67%), Dutch West Indian (36.5%, a difference of 0.69%), and Alaskan Athabascan (36.5%, a difference of 0.70%).
| Demographics | Rating | Rank | Associate's Degree |
| Yaqui | 0.0 /100 | #317 | Tragic 37.6% |
| Alaska Natives | 0.0 /100 | #318 | Tragic 37.5% |
| Fijians | 0.0 /100 | #319 | Tragic 37.4% |
| Cajuns | 0.0 /100 | #320 | Tragic 37.4% |
| Immigrants | Yemen | 0.0 /100 | #321 | Tragic 37.3% |
| Pennsylvania Germans | 0.0 /100 | #322 | Tragic 37.2% |
| Immigrants | Cabo Verde | 0.0 /100 | #323 | Tragic 36.8% |
| Arapaho | 0.0 /100 | #324 | Tragic 36.7% |
| Menominee | 0.0 /100 | #325 | Tragic 36.7% |
| Kiowa | 0.0 /100 | #326 | Tragic 36.5% |
| Dutch West Indians | 0.0 /100 | #327 | Tragic 36.5% |
| Alaskan Athabascans | 0.0 /100 | #328 | Tragic 36.5% |
| Paiute | 0.0 /100 | #329 | Tragic 36.4% |
| Apache | 0.0 /100 | #330 | Tragic 36.2% |
| Immigrants | Azores | 0.0 /100 | #331 | Tragic 35.6% |
Demographics Similar to Kenyans by Associate's Degree
In terms of associate's degree, the demographic groups most similar to Kenyans are South American (47.1%, a difference of 0.010%), Sudanese (47.1%, a difference of 0.030%), Immigrants from Germany (47.1%, a difference of 0.080%), Immigrants from Kenya (47.2%, a difference of 0.13%), and Immigrants from Poland (47.1%, a difference of 0.13%).
| Demographics | Rating | Rank | Associate's Degree |
| South American Indians | 76.7 /100 | #148 | Good 47.4% |
| Immigrants | Armenia | 76.6 /100 | #149 | Good 47.4% |
| Iraqis | 76.2 /100 | #150 | Good 47.4% |
| Immigrants | North Macedonia | 76.0 /100 | #151 | Good 47.4% |
| Immigrants | Afghanistan | 74.3 /100 | #152 | Good 47.3% |
| Czechs | 72.2 /100 | #153 | Good 47.2% |
| Immigrants | Kenya | 72.1 /100 | #154 | Good 47.2% |
| Kenyans | 70.6 /100 | #155 | Good 47.1% |
| South Americans | 70.5 /100 | #156 | Good 47.1% |
| Sudanese | 70.3 /100 | #157 | Good 47.1% |
| Immigrants | Germany | 69.7 /100 | #158 | Good 47.1% |
| Immigrants | Poland | 69.2 /100 | #159 | Good 47.1% |
| Scottish | 65.4 /100 | #160 | Good 46.9% |
| Scandinavians | 65.2 /100 | #161 | Good 46.9% |
| Immigrants | Africa | 63.2 /100 | #162 | Good 46.8% |