Immigrants from Portugal vs Kenyan Associate's Degree
COMPARE
Immigrants from Portugal
Kenyan
Associate's Degree
Associate's Degree Comparison
Immigrants from Portugal
Kenyans
40.1%
ASSOCIATE'S DEGREE
0.1/ 100
METRIC RATING
281st/ 347
METRIC RANK
47.1%
ASSOCIATE'S DEGREE
70.6/ 100
METRIC RATING
155th/ 347
METRIC RANK
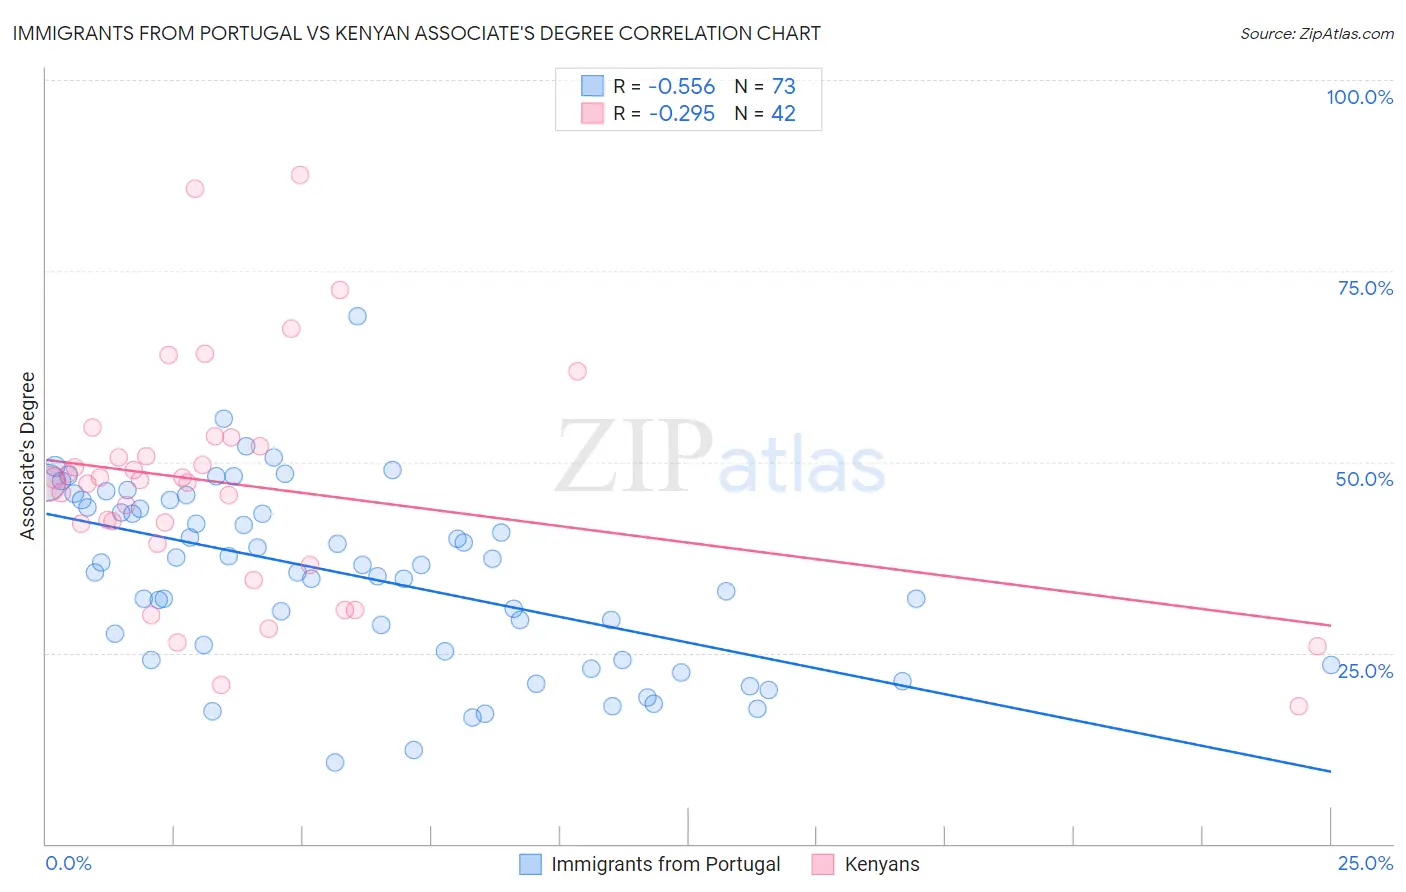
Immigrants from Portugal vs Kenyan Associate's Degree Correlation Chart
The statistical analysis conducted on geographies consisting of 174,792,107 people shows a substantial negative correlation between the proportion of Immigrants from Portugal and percentage of population with at least associate's degree education in the United States with a correlation coefficient (R) of -0.556 and weighted average of 40.1%. Similarly, the statistical analysis conducted on geographies consisting of 168,244,481 people shows a weak negative correlation between the proportion of Kenyans and percentage of population with at least associate's degree education in the United States with a correlation coefficient (R) of -0.295 and weighted average of 47.1%, a difference of 17.4%.
Associate's Degree Correlation Summary
| Measurement | Immigrants from Portugal | Kenyan |
| Minimum | 10.6% | 18.0% |
| Maximum | 69.0% | 87.6% |
| Range | 58.4% | 69.6% |
| Mean | 35.1% | 47.0% |
| Median | 36.6% | 47.5% |
| Interquartile 25% (IQ1) | 24.6% | 39.3% |
| Interquartile 75% (IQ3) | 44.5% | 52.1% |
| Interquartile Range (IQR) | 19.9% | 12.8% |
| Standard Deviation (Sample) | 11.8% | 15.0% |
| Standard Deviation (Population) | 11.7% | 14.8% |
Similar Demographics by Associate's Degree
Demographics Similar to Immigrants from Portugal by Associate's Degree
In terms of associate's degree, the demographic groups most similar to Immigrants from Portugal are Immigrants from Micronesia (40.2%, a difference of 0.10%), Immigrants from Nicaragua (40.3%, a difference of 0.30%), Bangladeshi (40.0%, a difference of 0.31%), Ottawa (40.3%, a difference of 0.34%), and Haitian (40.0%, a difference of 0.46%).
| Demographics | Rating | Rank | Associate's Degree |
| Immigrants | Dominica | 0.1 /100 | #274 | Tragic 40.5% |
| Potawatomi | 0.1 /100 | #275 | Tragic 40.4% |
| Puerto Ricans | 0.1 /100 | #276 | Tragic 40.4% |
| Blackfeet | 0.1 /100 | #277 | Tragic 40.3% |
| Ottawa | 0.1 /100 | #278 | Tragic 40.3% |
| Immigrants | Nicaragua | 0.1 /100 | #279 | Tragic 40.3% |
| Immigrants | Micronesia | 0.1 /100 | #280 | Tragic 40.2% |
| Immigrants | Portugal | 0.1 /100 | #281 | Tragic 40.1% |
| Bangladeshis | 0.1 /100 | #282 | Tragic 40.0% |
| Haitians | 0.1 /100 | #283 | Tragic 40.0% |
| Comanche | 0.1 /100 | #284 | Tragic 39.9% |
| Immigrants | Belize | 0.1 /100 | #285 | Tragic 39.9% |
| Immigrants | Caribbean | 0.0 /100 | #286 | Tragic 39.7% |
| Aleuts | 0.0 /100 | #287 | Tragic 39.6% |
| Immigrants | Cuba | 0.0 /100 | #288 | Tragic 39.5% |
Demographics Similar to Kenyans by Associate's Degree
In terms of associate's degree, the demographic groups most similar to Kenyans are South American (47.1%, a difference of 0.010%), Sudanese (47.1%, a difference of 0.030%), Immigrants from Germany (47.1%, a difference of 0.080%), Immigrants from Kenya (47.2%, a difference of 0.13%), and Immigrants from Poland (47.1%, a difference of 0.13%).
| Demographics | Rating | Rank | Associate's Degree |
| South American Indians | 76.7 /100 | #148 | Good 47.4% |
| Immigrants | Armenia | 76.6 /100 | #149 | Good 47.4% |
| Iraqis | 76.2 /100 | #150 | Good 47.4% |
| Immigrants | North Macedonia | 76.0 /100 | #151 | Good 47.4% |
| Immigrants | Afghanistan | 74.3 /100 | #152 | Good 47.3% |
| Czechs | 72.2 /100 | #153 | Good 47.2% |
| Immigrants | Kenya | 72.1 /100 | #154 | Good 47.2% |
| Kenyans | 70.6 /100 | #155 | Good 47.1% |
| South Americans | 70.5 /100 | #156 | Good 47.1% |
| Sudanese | 70.3 /100 | #157 | Good 47.1% |
| Immigrants | Germany | 69.7 /100 | #158 | Good 47.1% |
| Immigrants | Poland | 69.2 /100 | #159 | Good 47.1% |
| Scottish | 65.4 /100 | #160 | Good 46.9% |
| Scandinavians | 65.2 /100 | #161 | Good 46.9% |
| Immigrants | Africa | 63.2 /100 | #162 | Good 46.8% |